Examples of rastereasy use
Data for notebooks
This gallery showcases usage examples of the rastereasy library. To download all data and regenerate the results, please download the data from here and place the data folder in the same directory as your notebook.
You can download all notebooks here
Note for google colab users
To use the interactive plotting features in Google Colab, a special two-step setup is required. Follow these steps in the exact order. Separating the commands into different cells and restarting the session is essential.
— Step 1: Install Libraries
Run the following cell to install rastereasy and the necessary dependencies for interactive widgets.
!pip install rastereasy ipympl
from google.colab import output
output.enable_custom_widget_manager()
— Step 2: Restart the Runtime
After the installation is complete, you must restart the runtime.
Go to the menu:
Runtime > Restart runtime(or use the shortcut Ctrl+M).— Step 3: Run Your Code
After restarting, you can now enable the interactive mode and use the library in a new cell.
%matplotlib widget
import rastereasy
00 Quick Start

01 Read And Plot
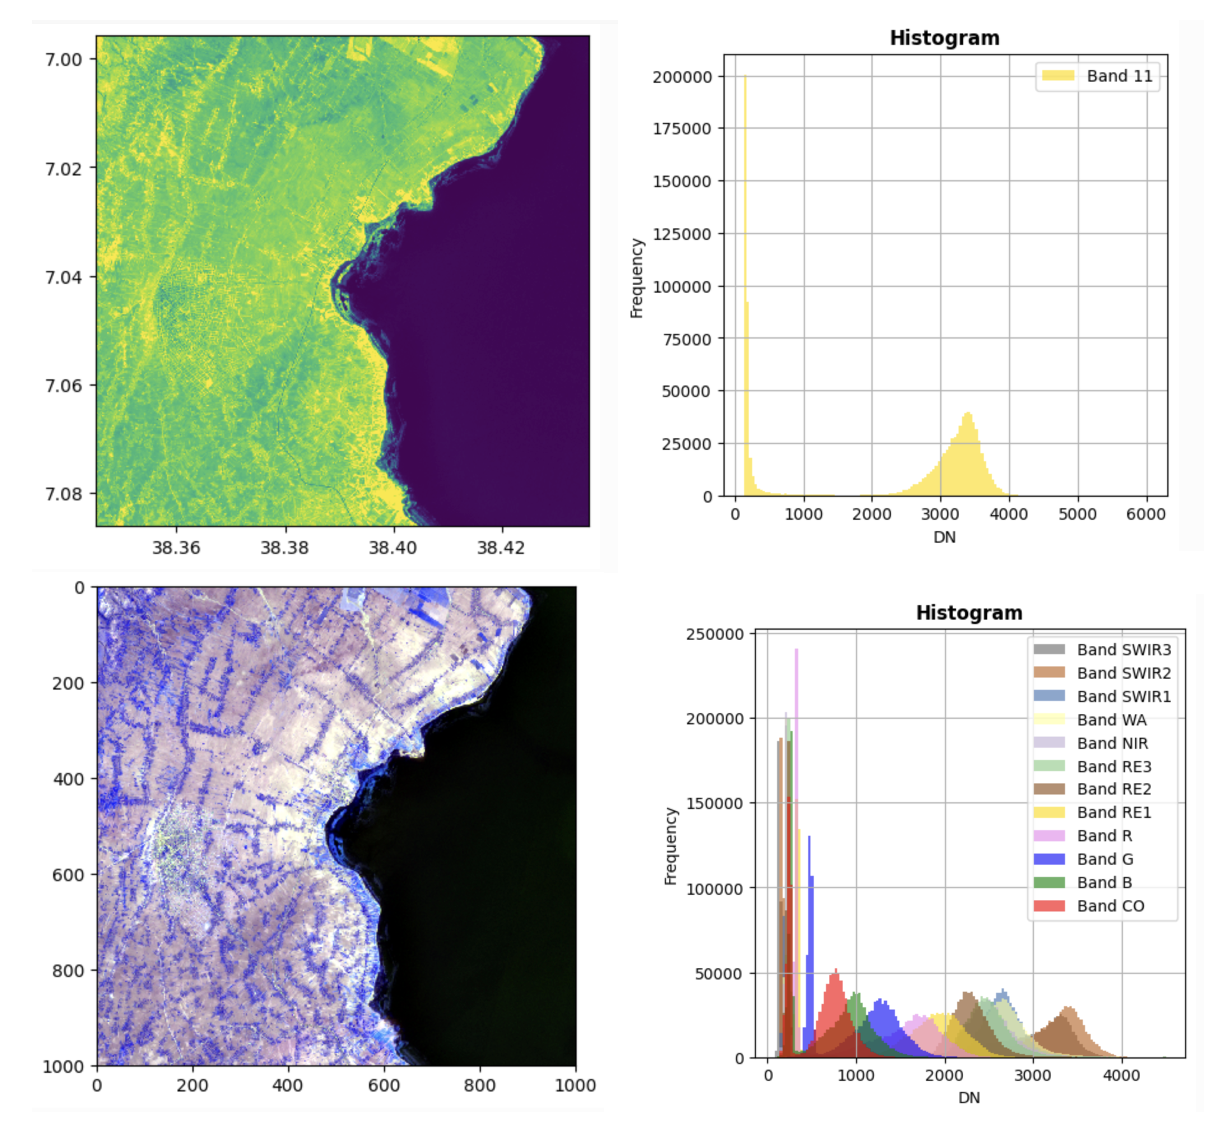
02 Plot Spectral Bands And Get Pixel Values
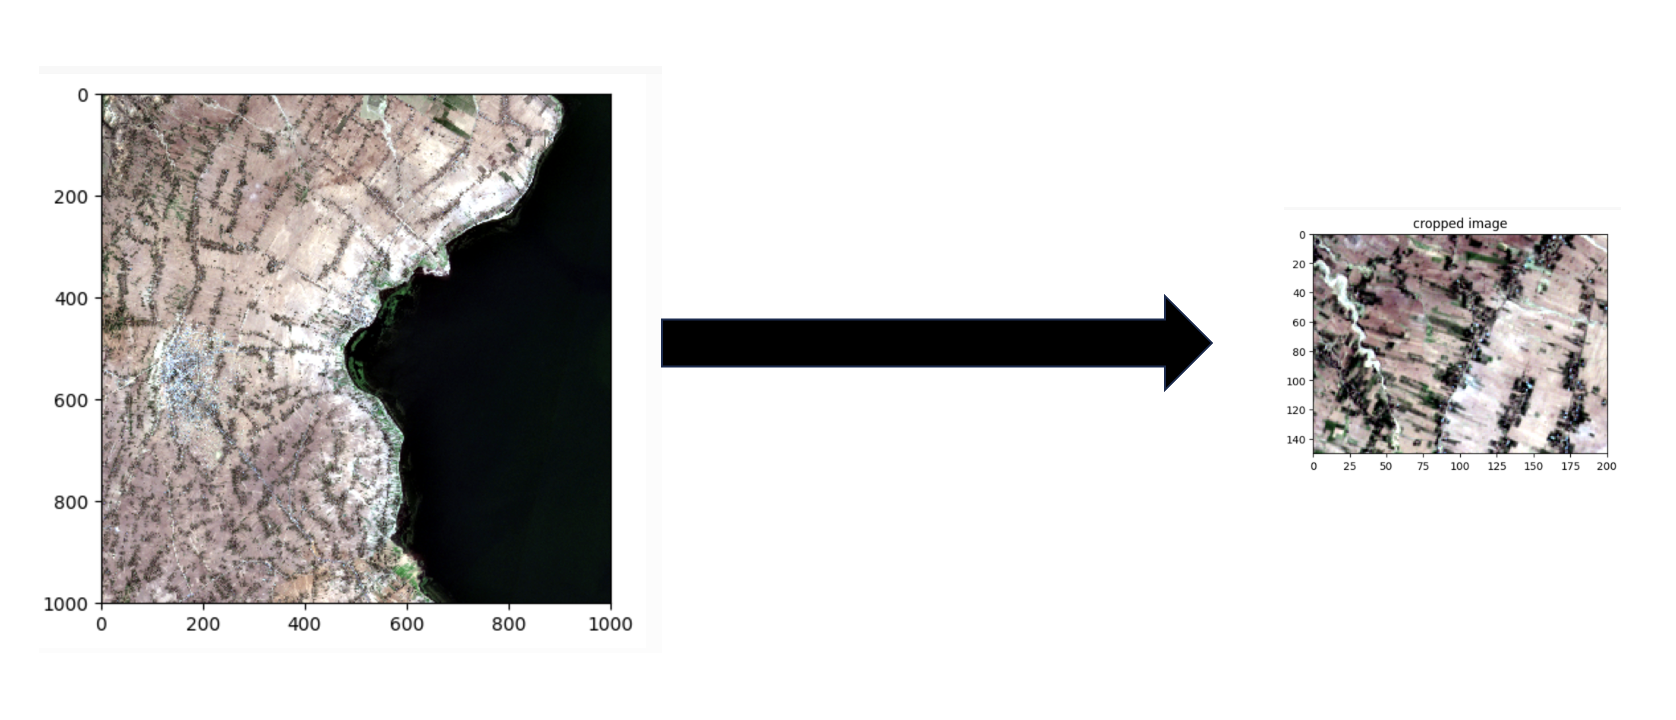
03 Crop Image
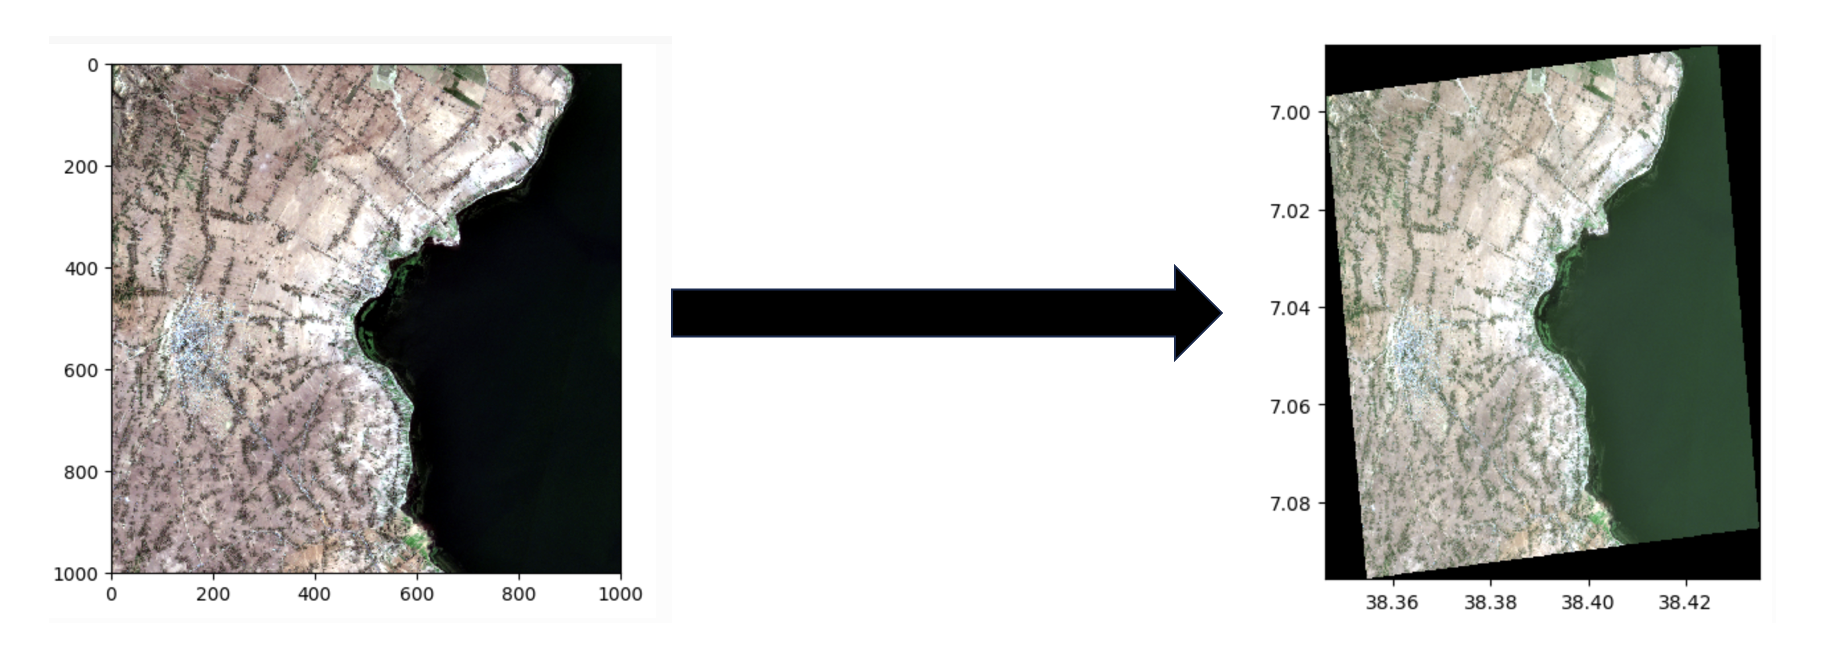
04 Reprojection
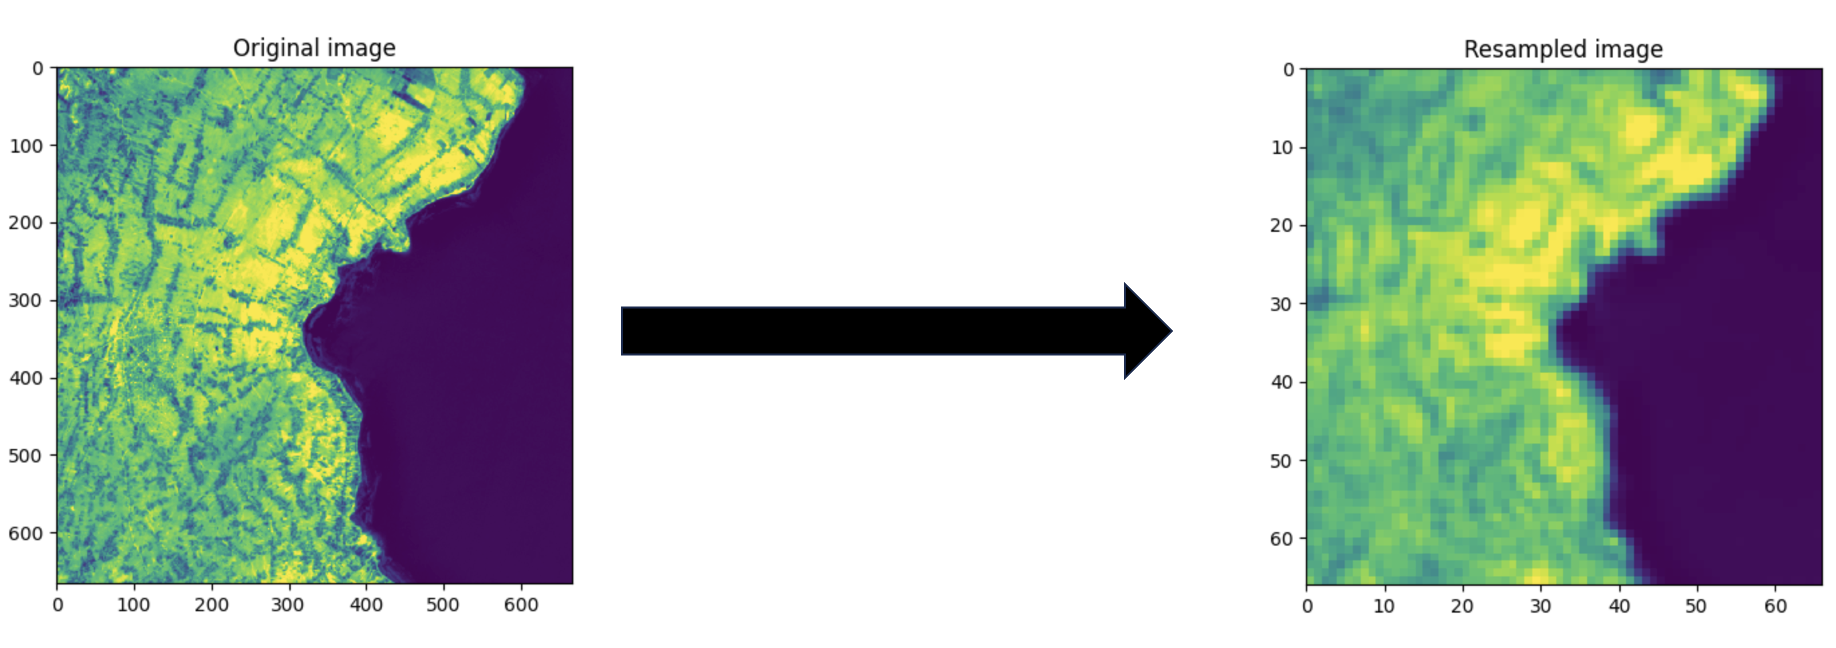
05 Resample
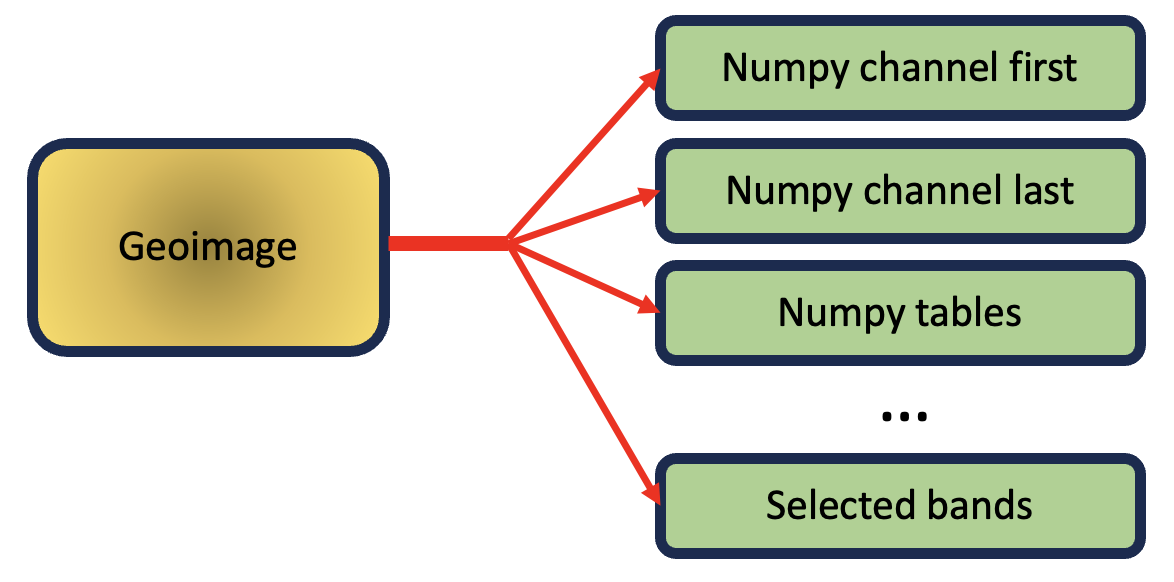
06 Deal With Numpy Arrays
07 Boolean Operations
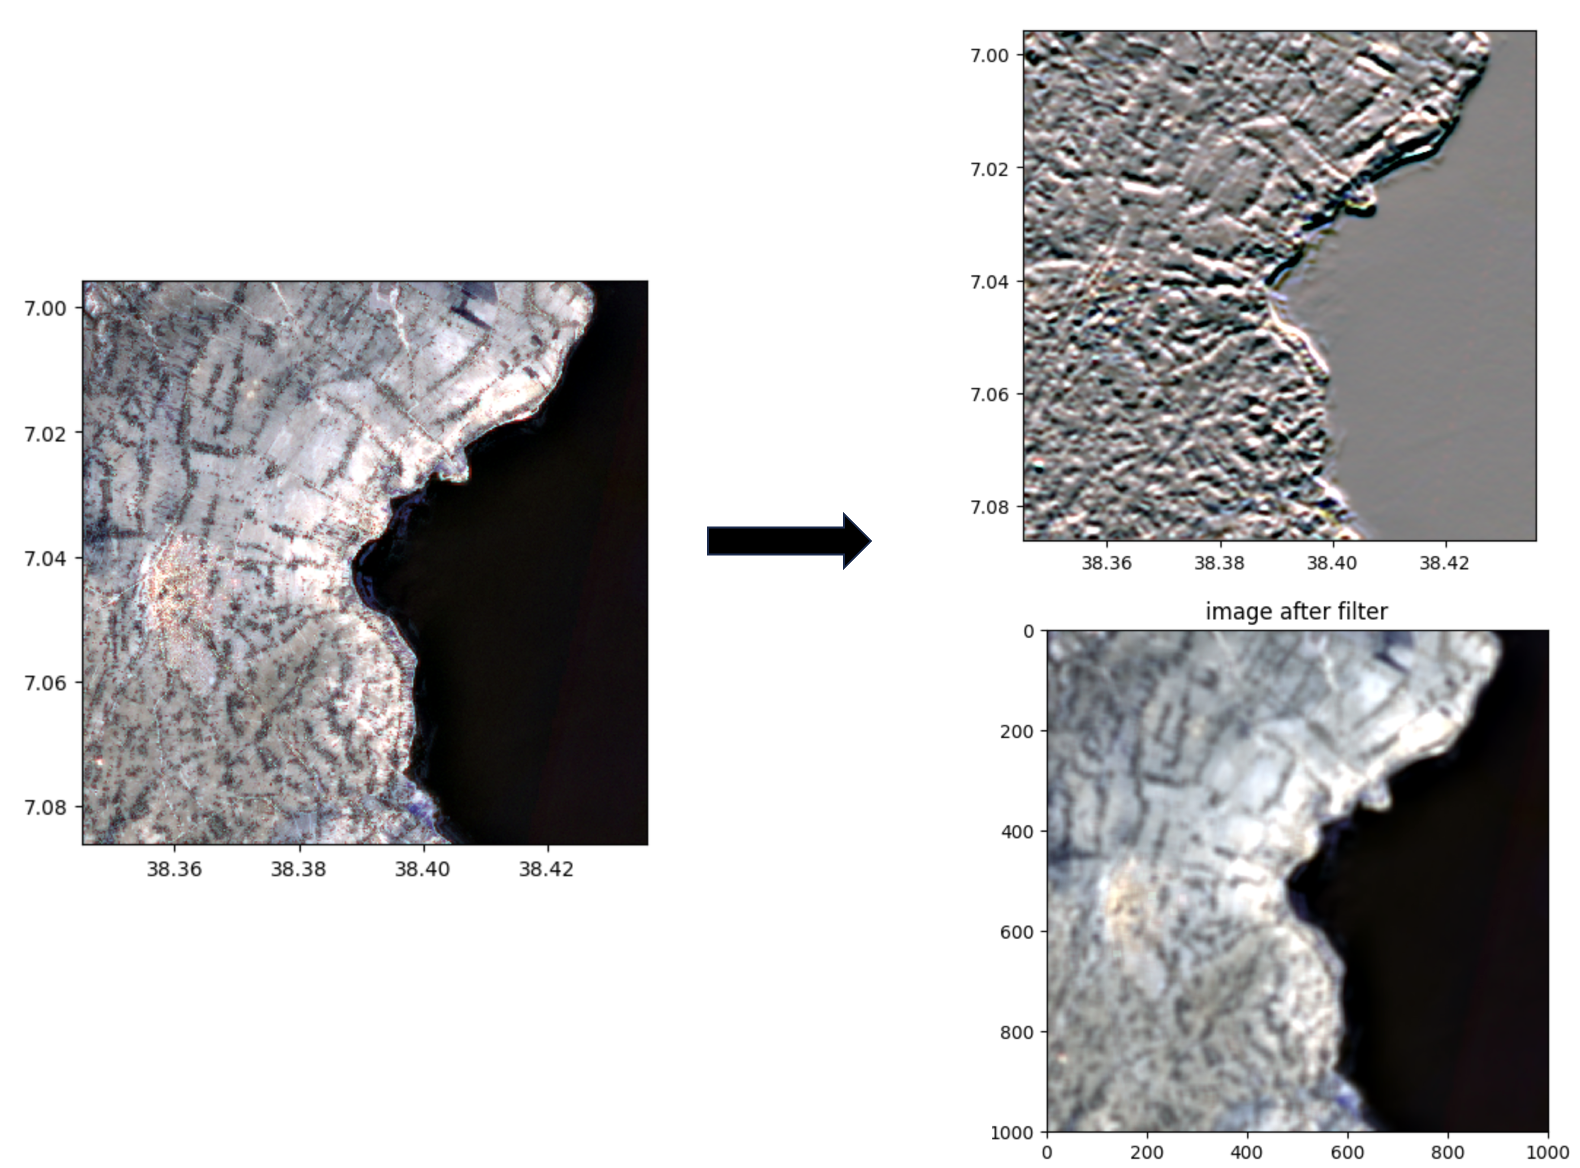
08 Apply Filters To Images
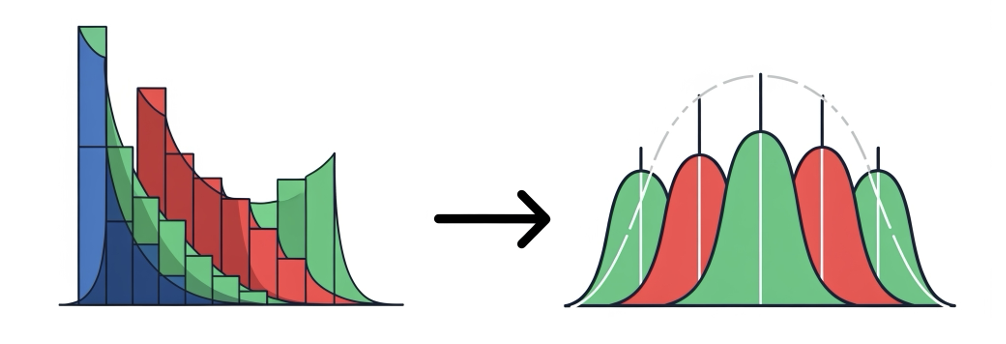
09 Standardization Of Bands
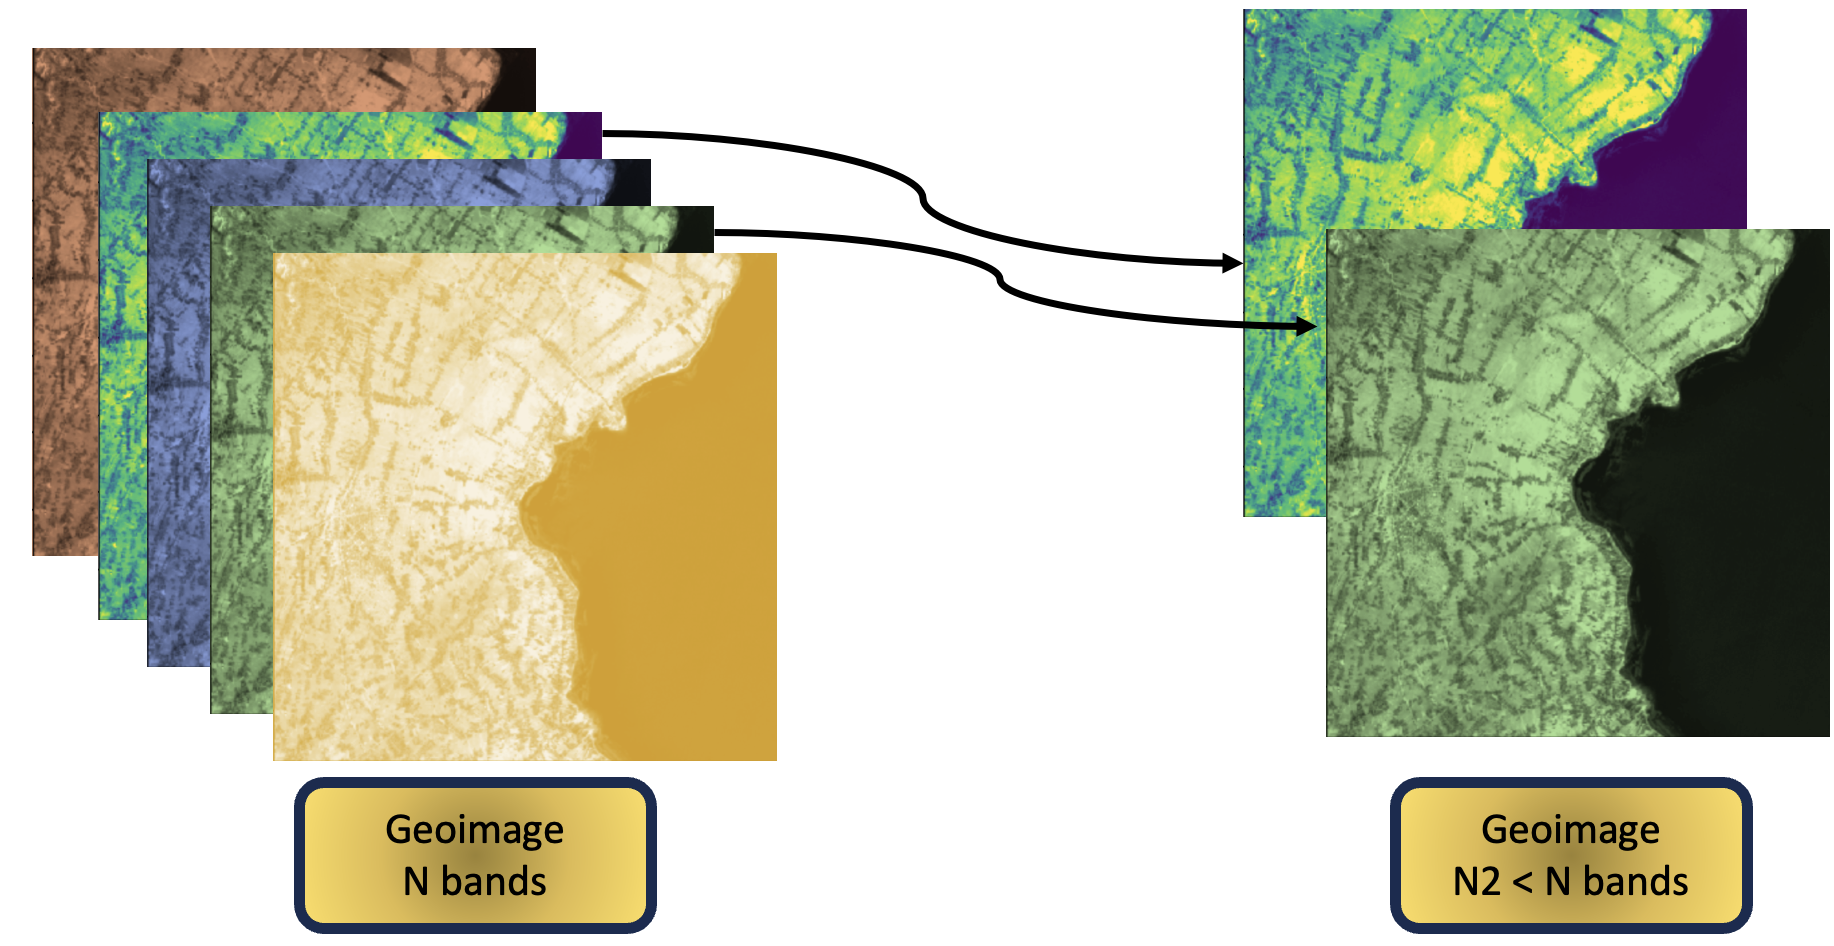
10 Select Bands
11 Pixel Vs Geo Coord
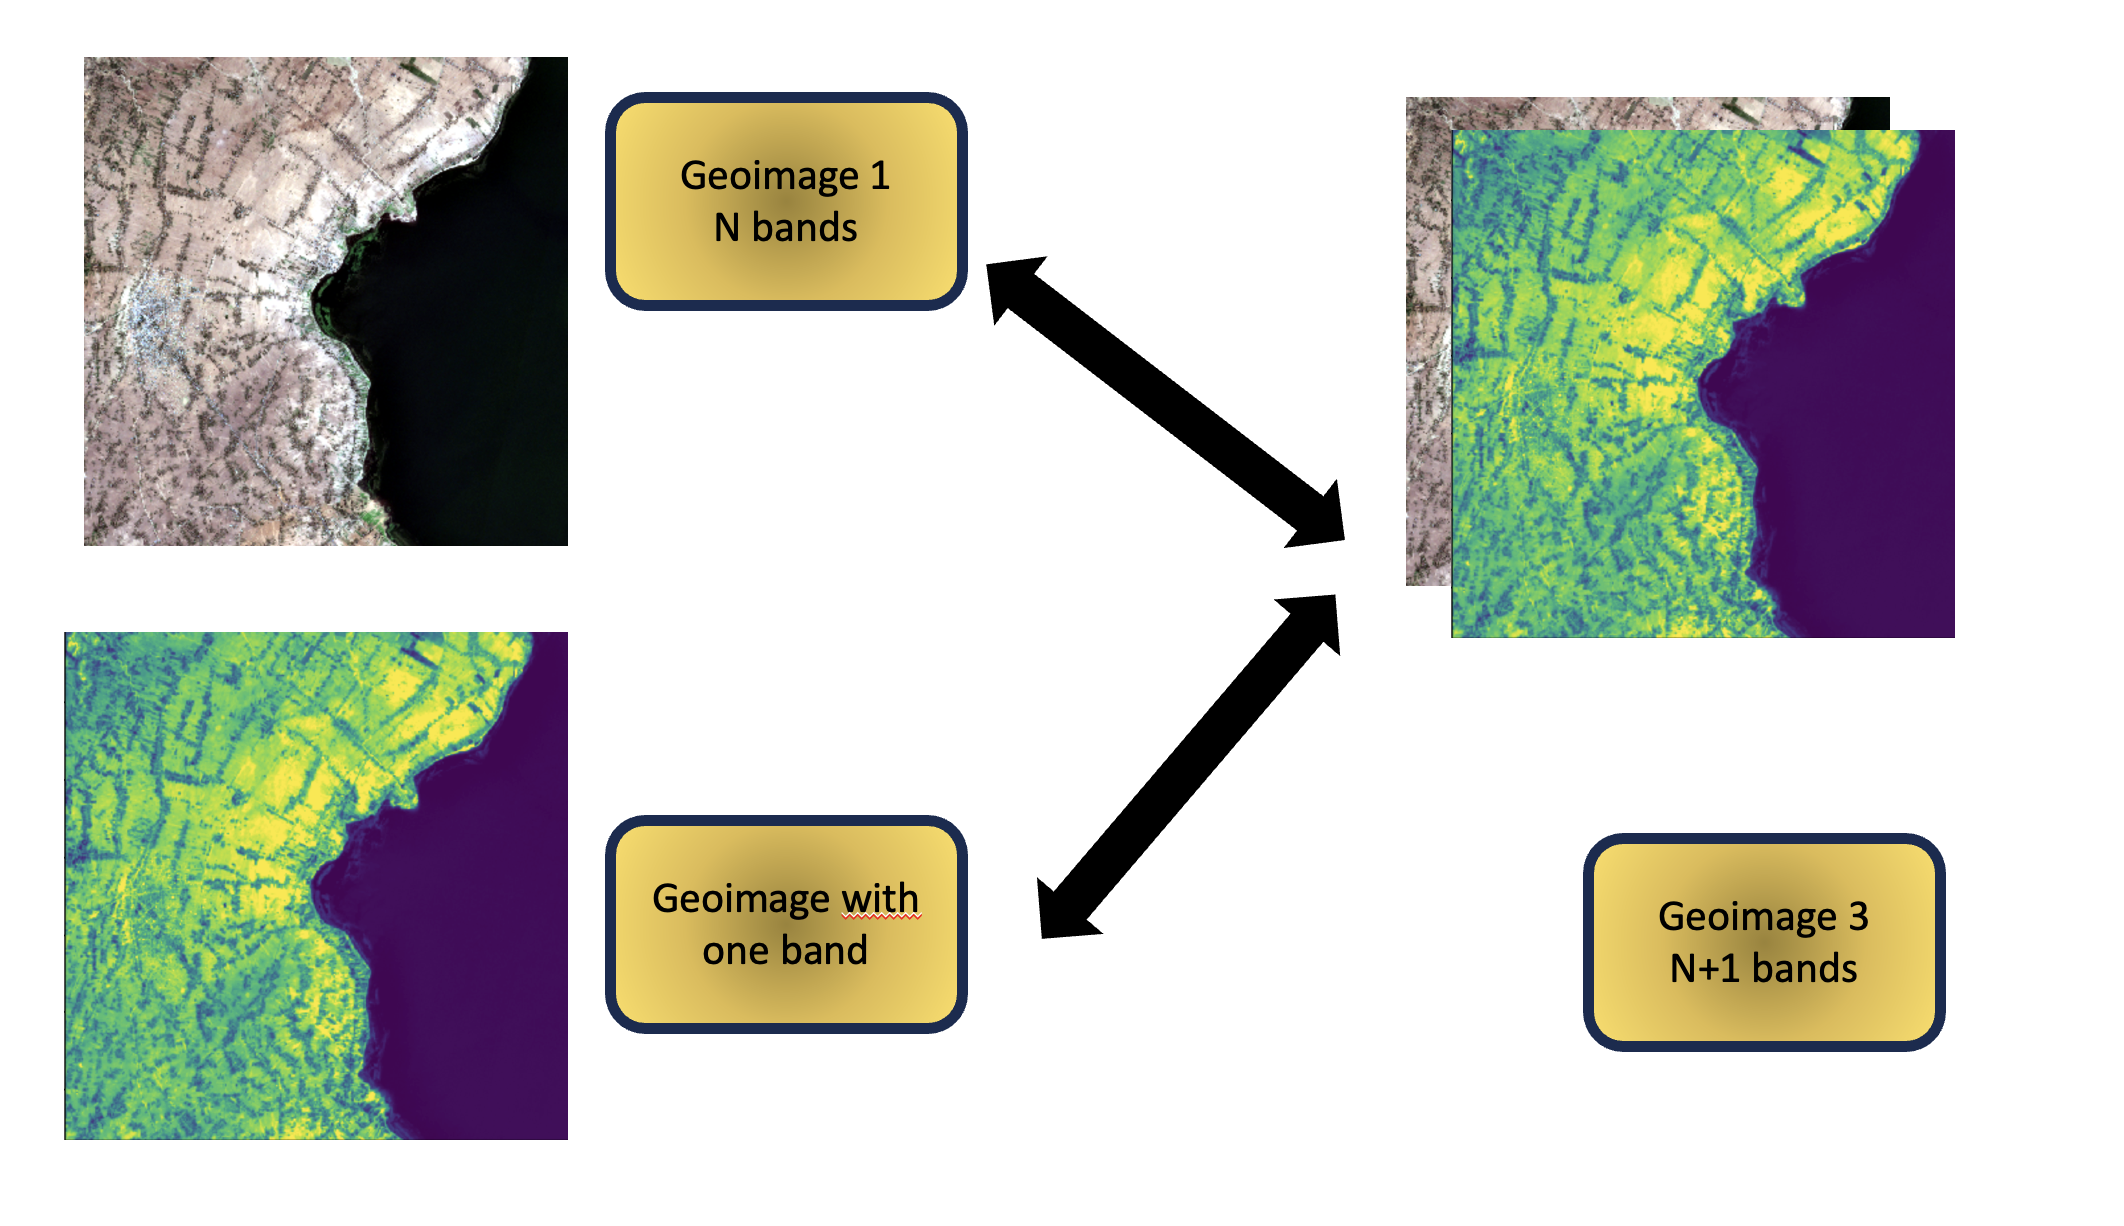
12 Add Bands
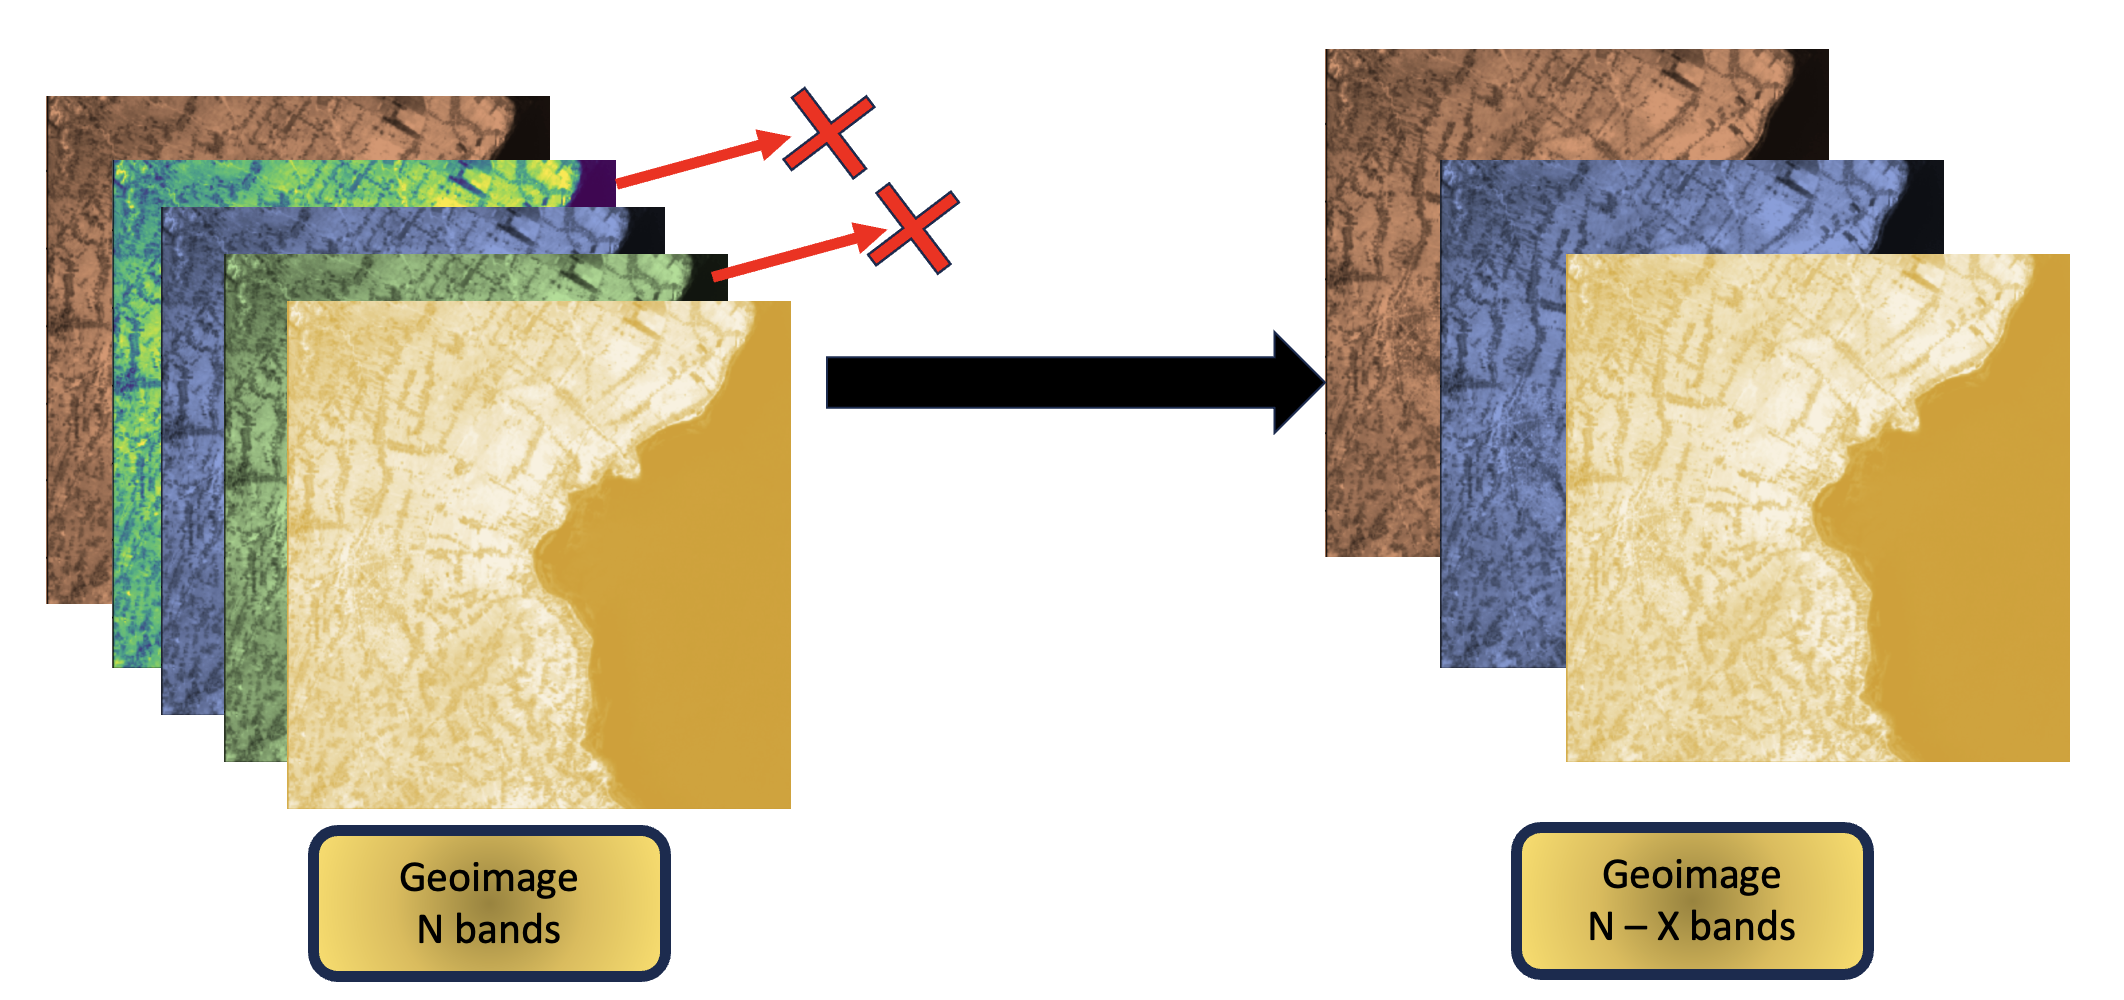
13 Remove Bands
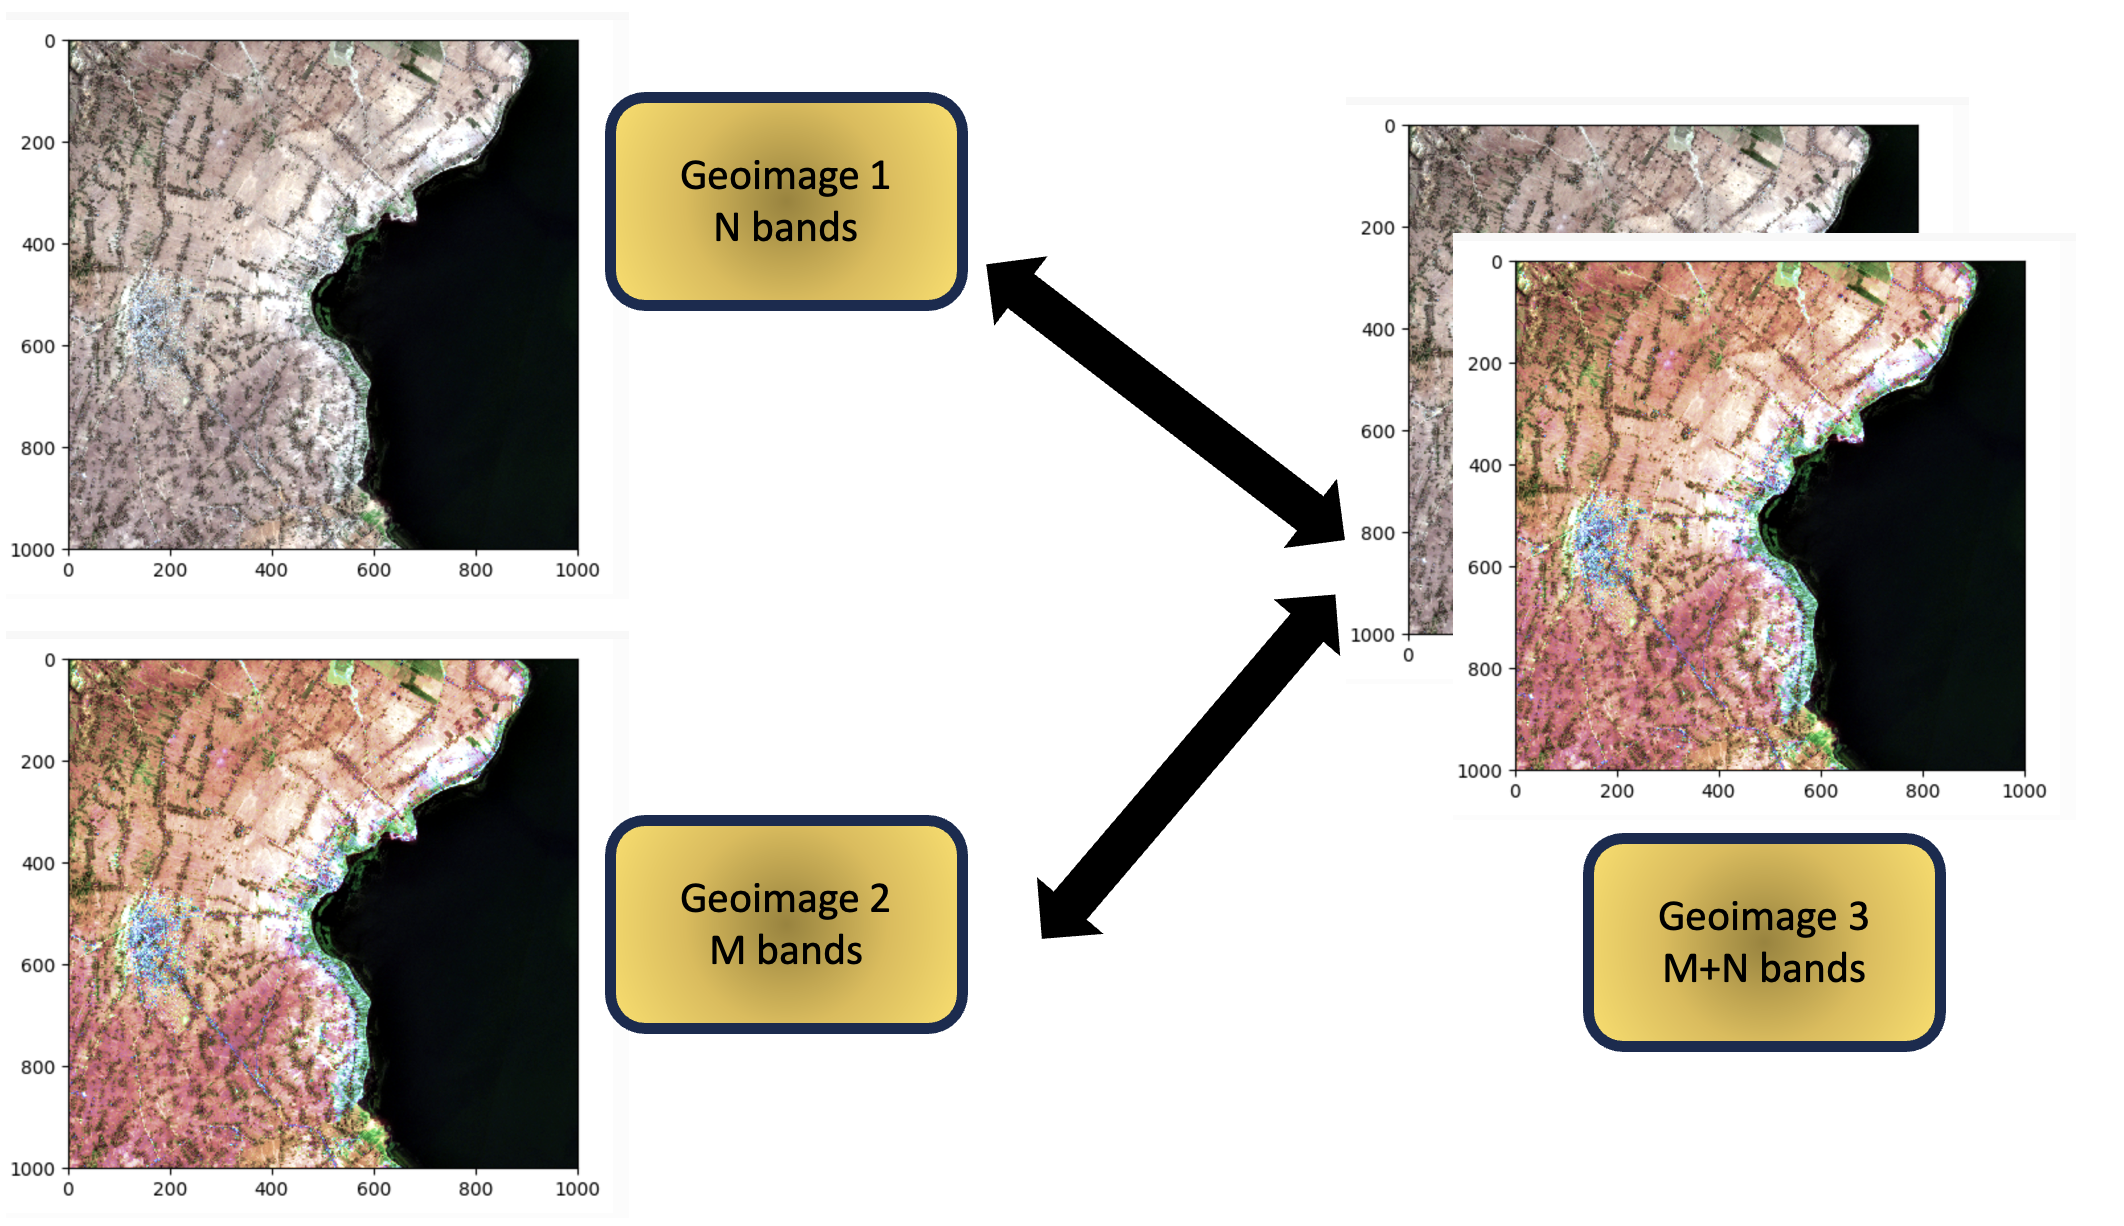
14 Stack Images
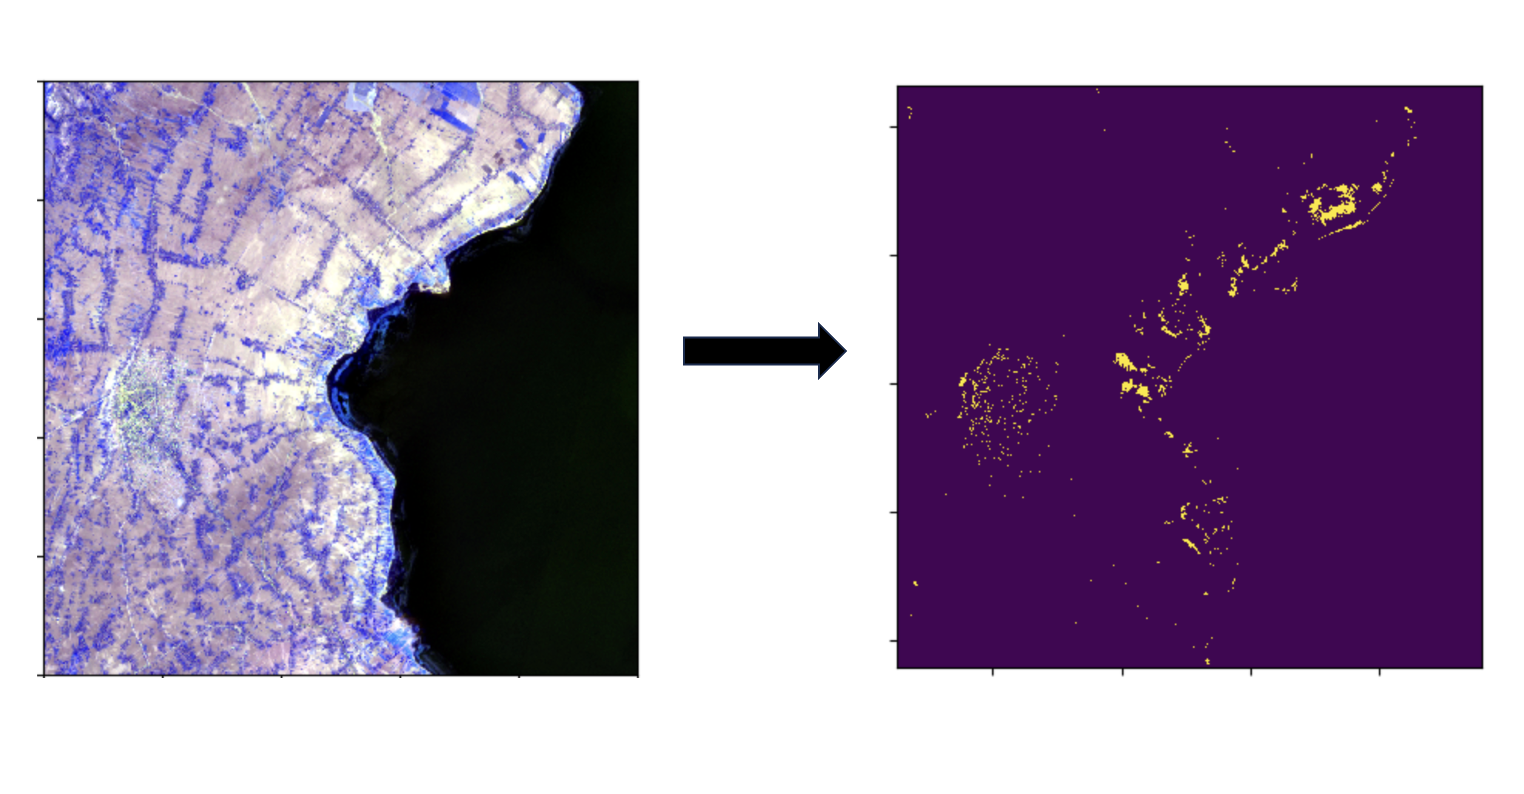
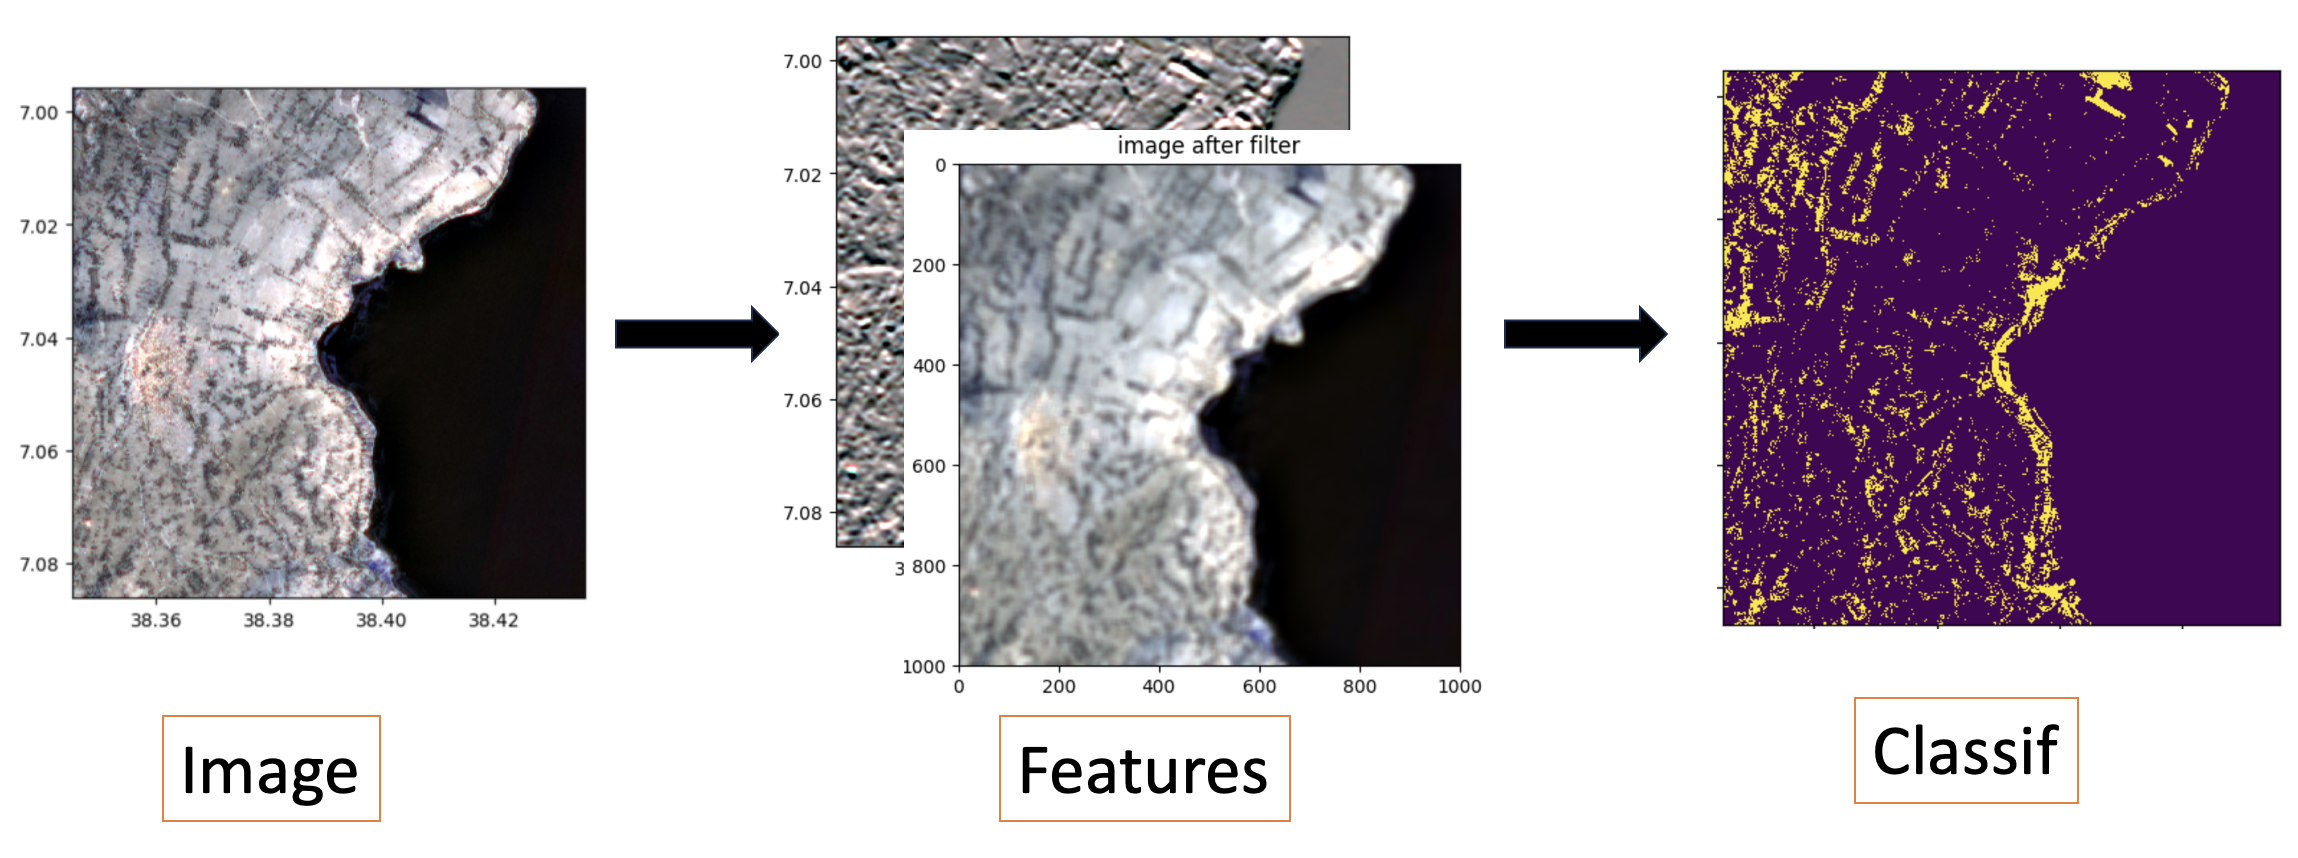
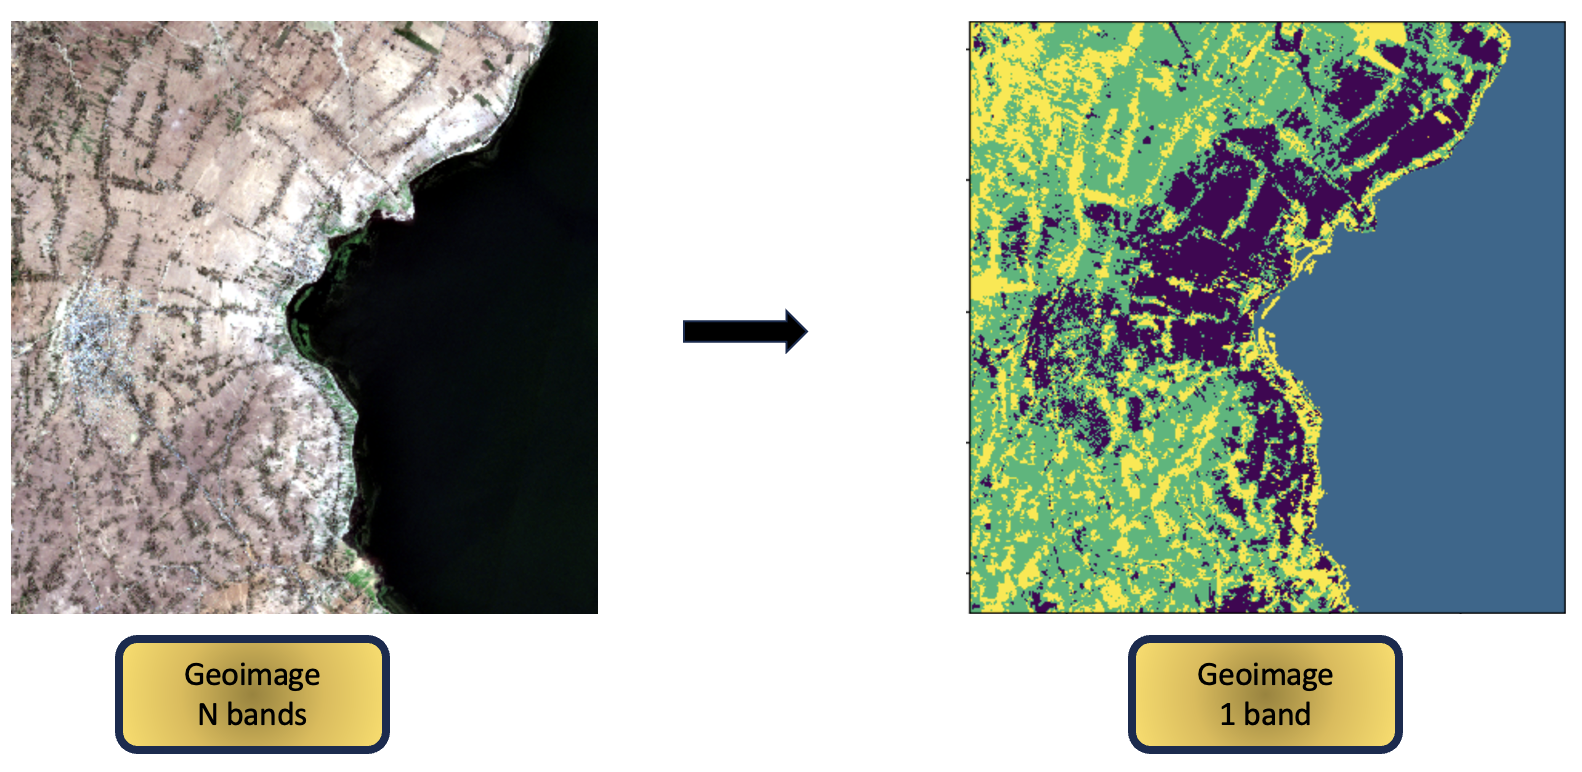
15 Compute Features And Classify Image
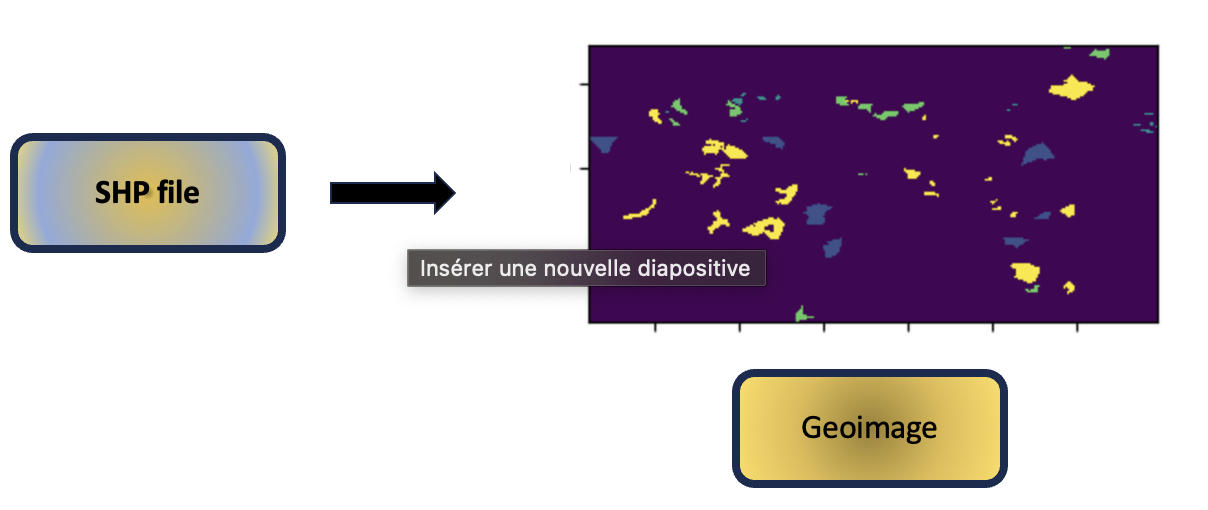
16 Extract From Shp
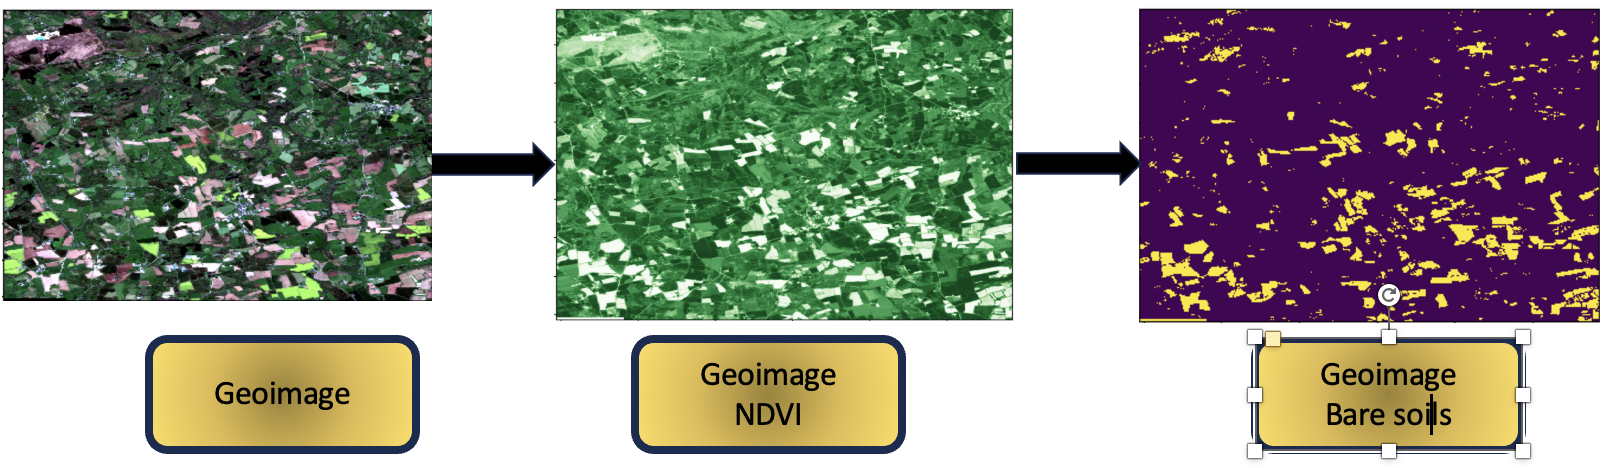
17 Compute Ndvi
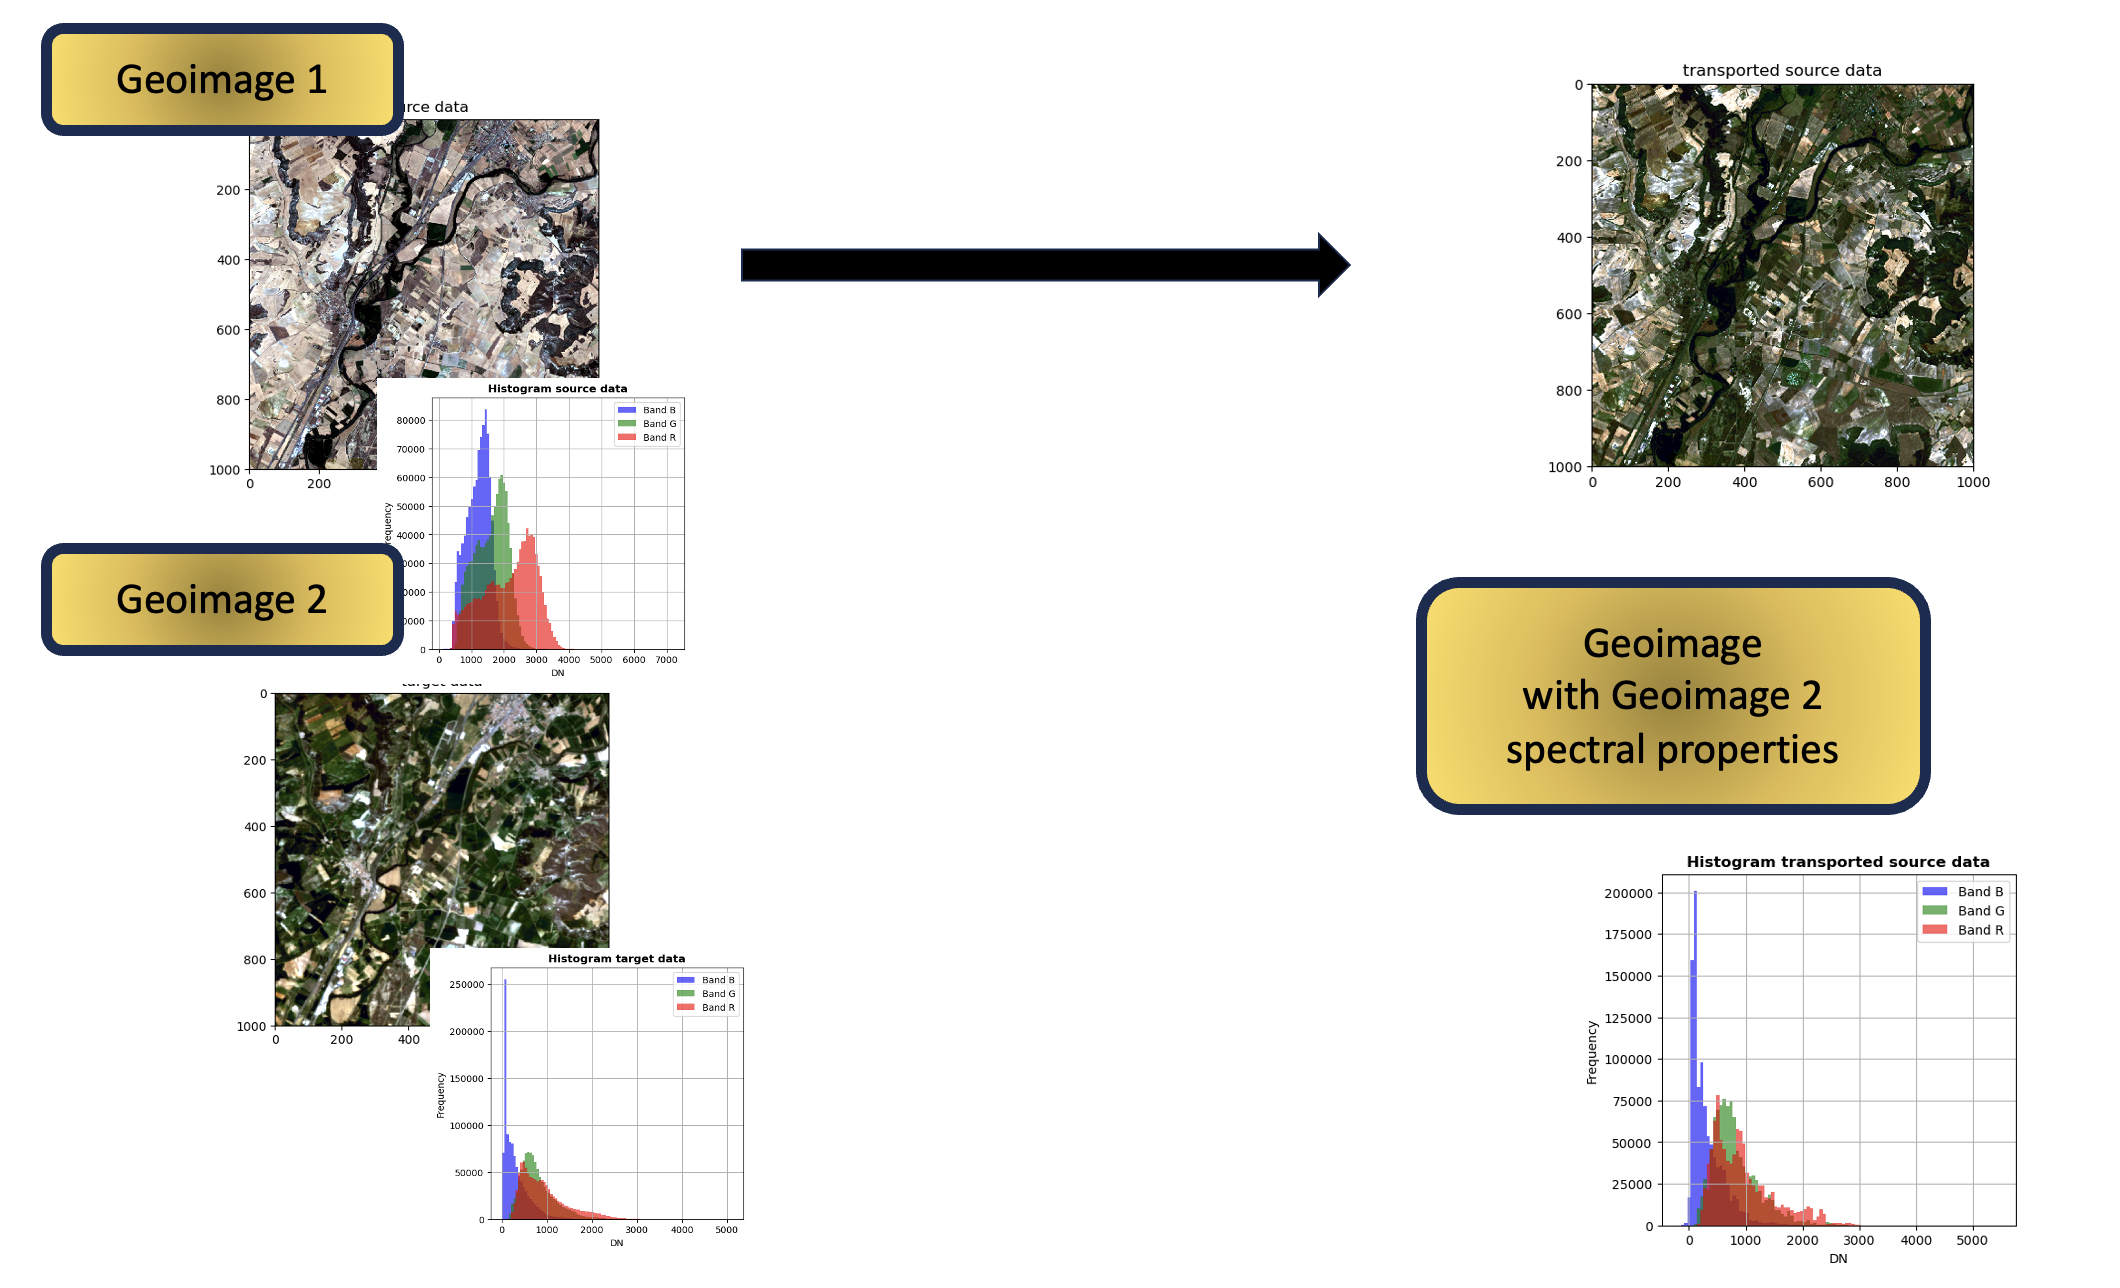
18 Adapt Bands With Ot
19 Kmeans
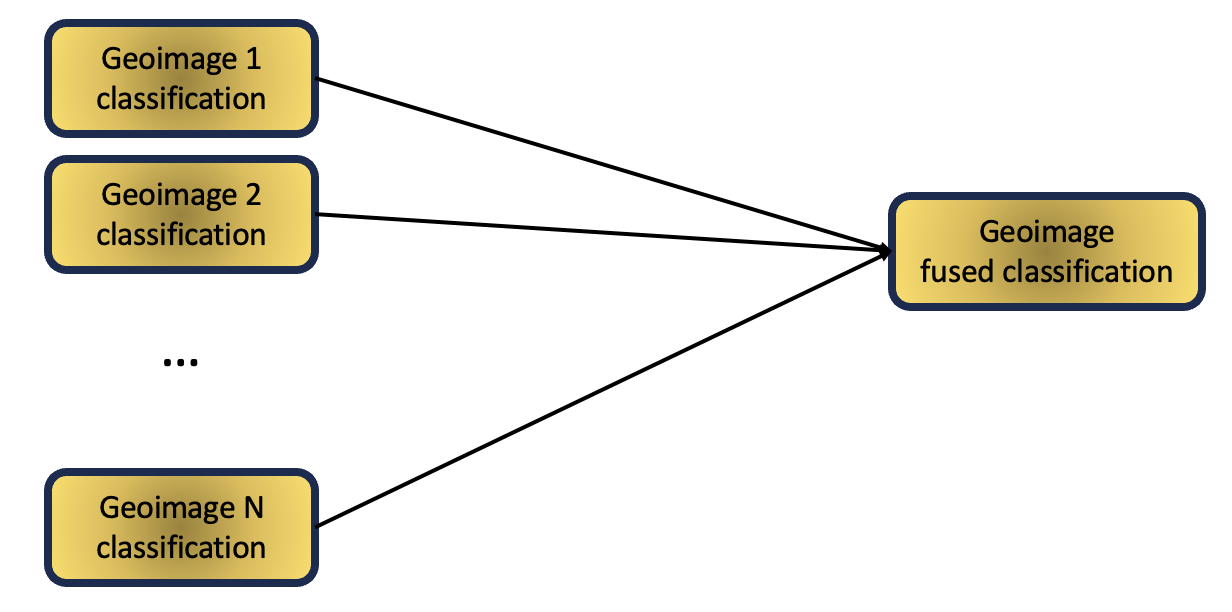
20 Fusion Dempster Shafer 2Hypotheses
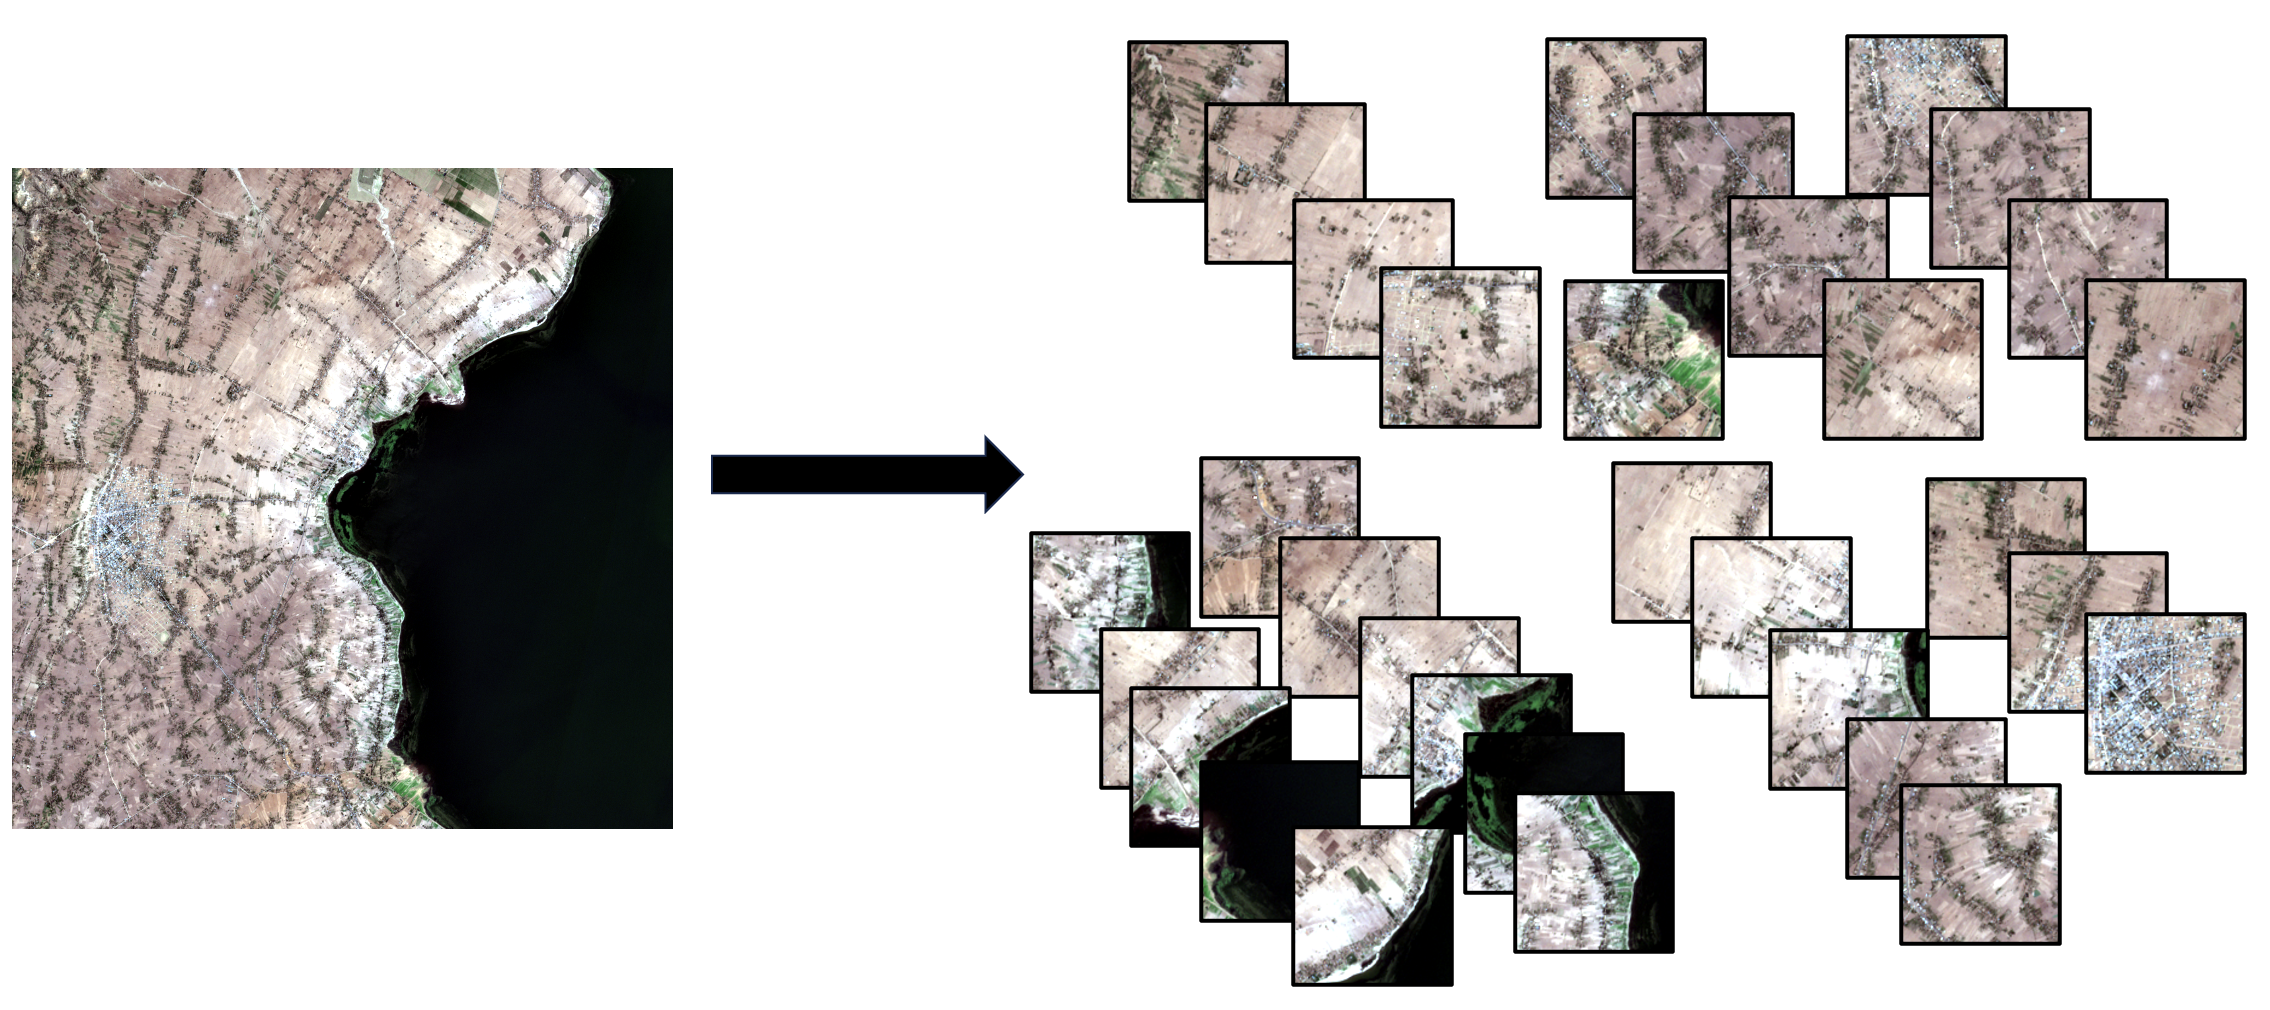
21 Prepare Snippets Data For Training
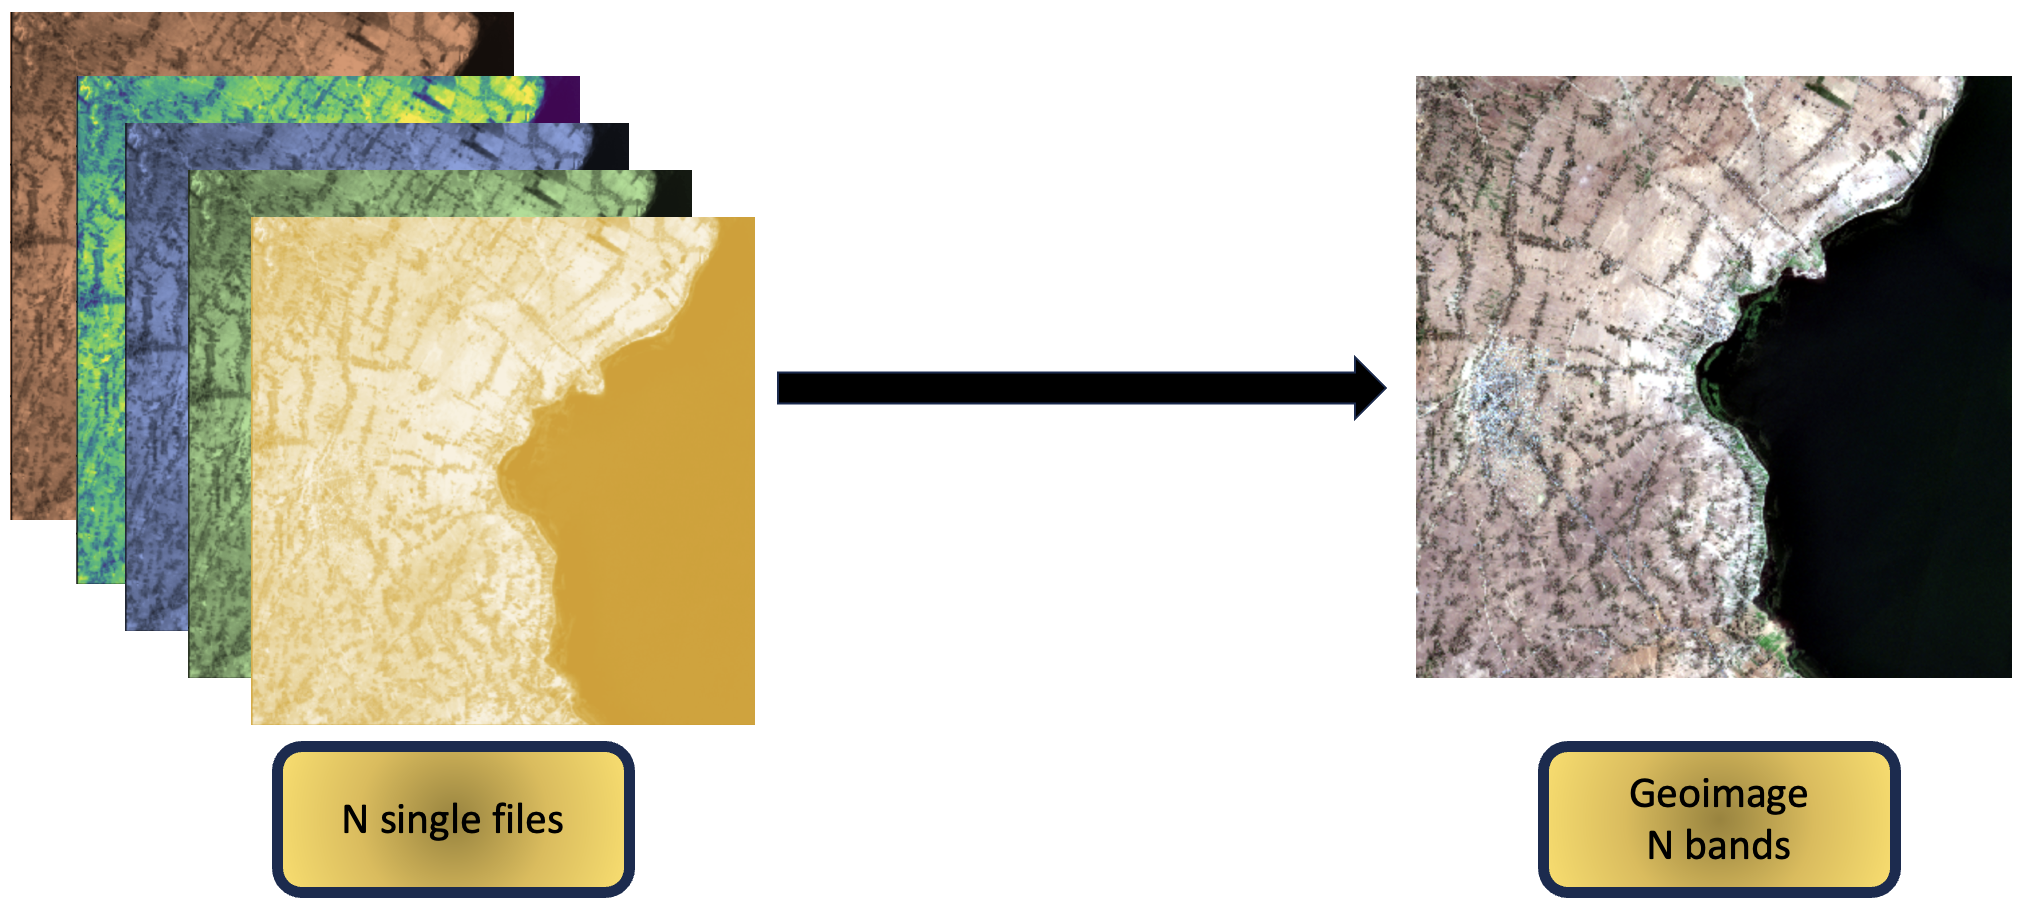
22 Create Geoimage From Single Bands
23 Save Images
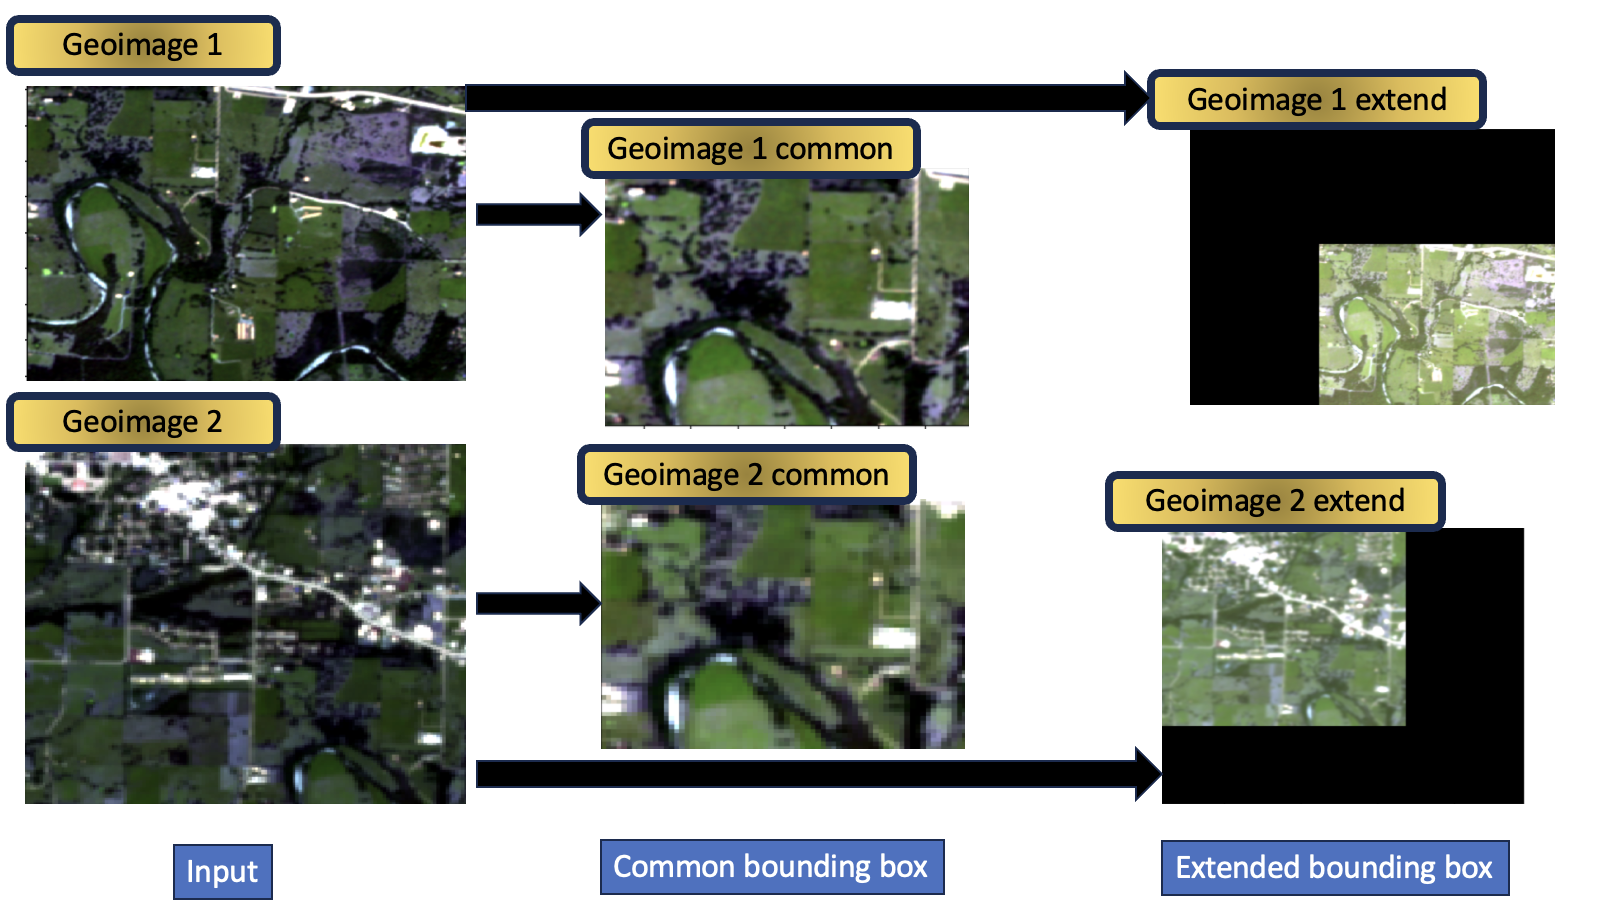
24 Deal With Bounding Boxes
25 Dimension Reduction