import rastereasy
Adding bands
The function add_band adds a band stored as a numpy table in the image. For stacking, it is better to use the stack function
Load images, change names (for better interpretation) and visualization of bands
name_im='./data/demo/sentinel.tif'
image=rastereasy.Geoimage(name_im,history=True)
names = {"NIR":8,"G":3,"CO" : 1,"SWIR2":11,"B": 2,"R":4,"RE1":5,"RE2":6,"RE3":7,"WA":9,"SWIR1":10,"SWIR3":12}
image_names=rastereasy.Geoimage(name_im,names=names,history=True)
image_names.info()
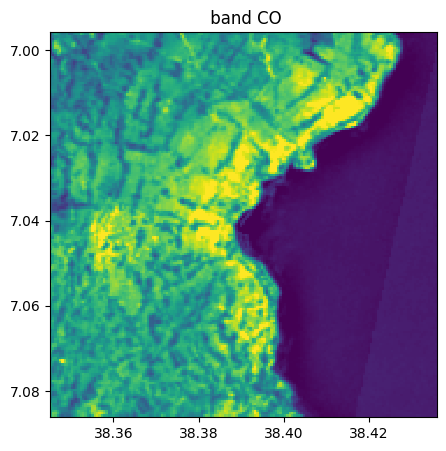
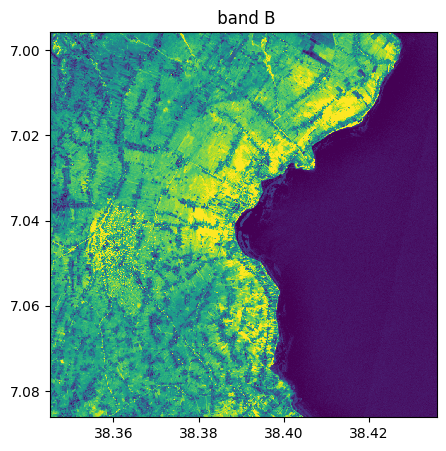
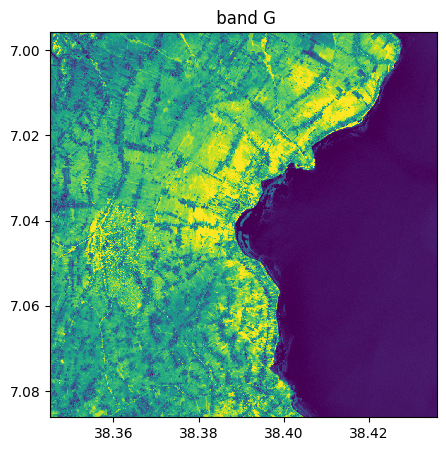
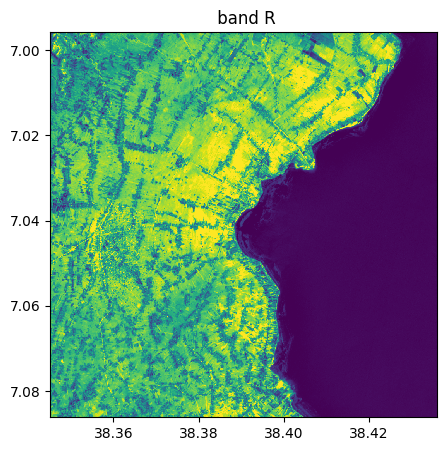
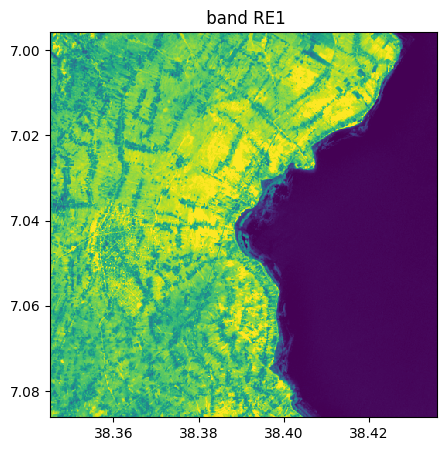
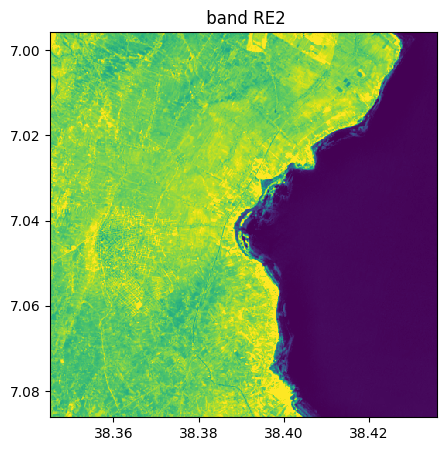
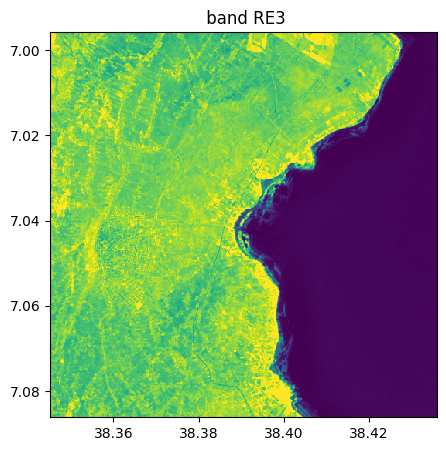
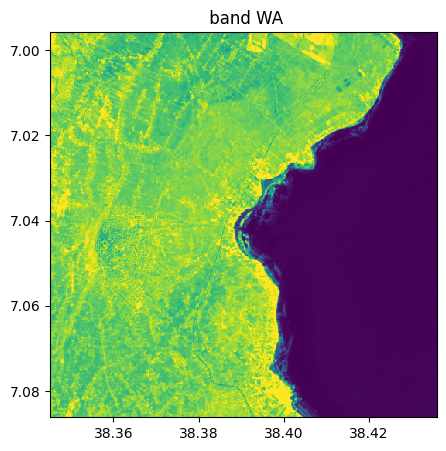
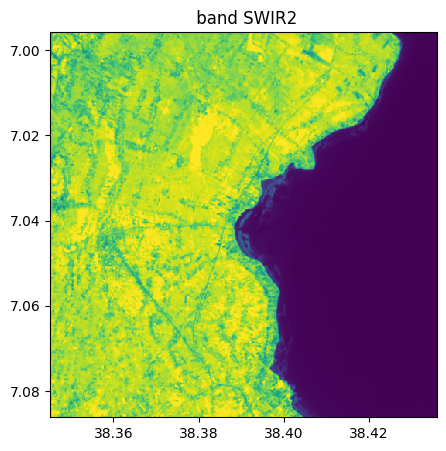
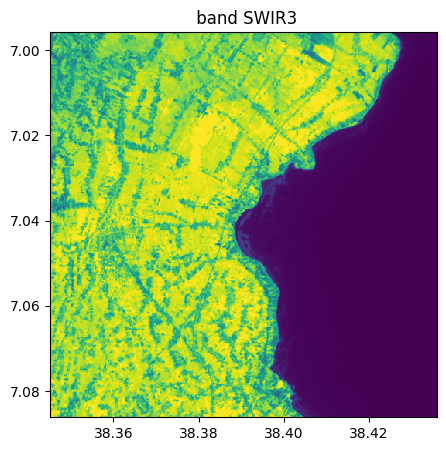
image_names.visu()
- Size of the image:
   - Rows (height): 1000
   - Cols (width): 1000
   - Bands: 12
- Spatial resolution: 10.0  meters / degree (depending on projection system)
- Central point latitude - longitude coordinates: (7.04099599, 38.39058840)
- Driver: GTiff
- Data type: int16
- Projection system: EPSG:32637
- Nodata: -32768.0

- Given names for spectral bands:
   {'CO': 1, 'B': 2, 'G': 3, 'R': 4, 'RE1': 5, 'RE2': 6, 'RE3': 7, 'NIR': 8, 'WA': 9, 'SWIR1': 10, 'SWIR2': 11, 'SWIR3': 12}

--- History of modifications---
[2025-06-04 15:29:50] - Read image ./data/demo/sentinel.tif
<Figure size 640x480 with 0 Axes>


help(image.add_band)
Help on method add_band in module rastereasy.rastereasy:

add_band(
    spectral_band,
    name_band=None,
    after_band=None,
    dtype=None,
    inplace=False,
    dest_name=None
) method of rastereasy.rastereasy.Geoimage instance
    Add a new spectral band to the image (in-place).

    This method adds a new spectral band to the current image. The new band can
    be placed at the end of the band stack (default) or after a specified band.

    Parameters
    ----------
    spectral_band : numpy.ndarray
        The spectral band data to add. Can be in any of the following formats:
        - 2D array with shape (rows, cols)
        - 3D array with shape (1, rows, cols)
        - 3D array with shape (rows, cols, 1)
        The spatial dimensions must match the current image.

    name_band : str, optional
        Name to assign to the new band. If None, a sequential name will be used.
        Default is None.

    after_band : str, int, or None, optional
        Specify where to insert the new band:
        - If None: Add to the end of the band stack (default)
        - If str or int: Insert after the specified band name or index
        Default is None.

    dtype : str or None, optional
        Data type for the new band and resulting image. If None, preserves the
        highest precision type between the current image and the new band.
        Common values: 'float64', 'float32', 'int32', 'uint16', 'uint8'.
        Default is None.

    inplace : bool, default False
        If False, return a copy of the image with added band
        Otherwise, adding band in place and return None.

    dest_name : str, optional
        Path to save the updated image. If None, the image is not saved.
        Default is None.

    Returns
    -------
    Geoimage
        The modified image with the new band added.

    Raises
    ------
    ValueError
        If dimensions don't match, if the dtype is unknown, or if the after_band
        doesn't exist in the image.

    Examples
    --------
    >>> # Add a NDVI band to the end
    >>> ndvi = (image.select_band('NIR') - image.select_band('Red') / (image.select_band('NIR') + image.select_band('Red')
    >>> image_and_ndvi = image.add_band(ndvi, name_band='NDVI')
    >>> image_and_ndvi.info()  # Shows NDVI as the last band
    >>>
    >>> # Add a band after a specific position
    >>> image_and_ndvi = image.add_band(thermal_data, name_band='TIR', after_band='NIR')
    >>>
    >>> # Add with explicit data type and save
    >>> image.add_band(elevation, name_band='DEM', dtype='float32',inplace = True,
    >>>                dest_name='with_dem.tif')

    Notes
    -----
    - This method modifies the current image by adding a new band.
    - The spatial dimensions (rows, cols) of the new band must match the current image.
    - To create a new image with an additional band without modifying the original,
    use apply_add_band() instead.
Add some bands
Two possibilities
Return a new image with bands added
Directly add bands from the image (option
inplace=True)
1. Return a new image with bands removed
# 1. Select one band in an image
band_nir=image_names.select_bands('NIR')
# 2. Add this band to the image
image_added = image_names.add_band(band_nir.image)
image_added.info()
- Size of the image:
   - Rows (height): 1000
   - Cols (width): 1000
   - Bands: 13
- Spatial resolution: 10.0  meters / degree (depending on projection system)
- Central point latitude - longitude coordinates: (7.04099599, 38.39058840)
- Driver: GTiff
- Data type: int16
- Projection system: EPSG:32637
- Nodata: -32768.0

- Given names for spectral bands:
   {'CO': 1, 'B': 2, 'G': 3, 'R': 4, 'RE1': 5, 'RE2': 6, 'RE3': 7, 'NIR': 8, 'WA': 9, 'SWIR1': 10, 'SWIR2': 11, 'SWIR3': 12, '13': 13}
2. Directly add bands from the image (option inplace=True)
image_names.add_band(band_nir.image,inplace=True)
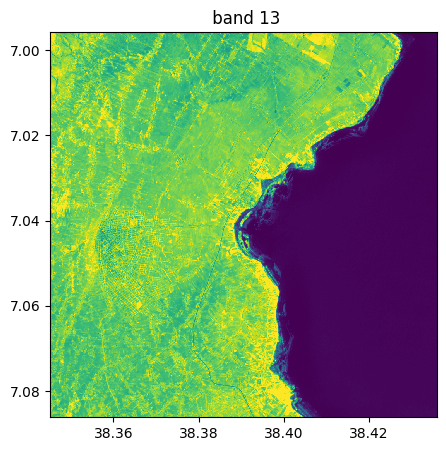
image_names.info()
image_names.visu()
- Size of the image:
   - Rows (height): 1000
   - Cols (width): 1000
   - Bands: 13
- Spatial resolution: 10.0  meters / degree (depending on projection system)
- Central point latitude - longitude coordinates: (7.04099599, 38.39058840)
- Driver: GTiff
- Data type: int16
- Projection system: EPSG:32637
- Nodata: -32768.0

- Given names for spectral bands:
   {'CO': 1, 'B': 2, 'G': 3, 'R': 4, 'RE1': 5, 'RE2': 6, 'RE3': 7, 'NIR': 8, 'WA': 9, 'SWIR1': 10, 'SWIR2': 11, 'SWIR3': 12, '13': 13}

--- History of modifications---
[2025-06-04 15:29:50] - Read image ./data/demo/sentinel.tif
[2025-06-04 15:29:52] - Added band "13" at the end. Original bands: 12, New total: 13. Data type: int16.
<Figure size 640x480 with 0 Axes>