import rastereasy
Extraction of specific bands
2 possibilities:
return a new image with some selected bands (function
select_bands)select only some specific bands of an image (function
select_bandswith optioninplace=True)
1) read image
name_im='./data/demo/sentinel.tif'
image=rastereasy.Geoimage(name_im)
help(image.select_bands)
Help on method select_bands in module rastereasy.rastereasy:

select_bands(bands=None, dest_name=None, inplace=False, reformat_names=False) method of rastereasy.rastereasy.Geoimage instance
    Select only specified bands in the image

    This method modifies the image to contain only the specified bands, discarding
    all other bands. Band naming can be preserved or updated based on parameters.

    Parameters
    ----------
    bands : str, list, int, or None, optional
        The bands to keep in the image. Format depends on band naming:
        - If using named bands: band name(s) as string(s) (e.g., 'NIR', ['R', 'G', 'B'])
        - If using indexed bands: band index/indices as int(s) or string(s) (e.g., 3, ['1', '4', '7'])
        If None, no bands are selected (invalid operation).

    dest_name : str, optional
        Path to save the modified image. If None, the image is not saved.
        Default is None.

    inplace : bool, default False
        If False, return a copy. Otherwise, modify the image by keeping only selected bands

    reformat_names : bool, optional
        Band naming behavior:
        - If True: Rename bands sequentially as "1", "2", "3", etc.
        - If False: Preserve original band names when possible
        Default is False.

    Returns
    -------
    Geoimage
        The modified image with only selected bands.

    Raises
    ------
    ValueError
        If no bands are specified, or if any specified band doesn't exist in the image.

    Examples
    --------
    >>> # Extract only 3 specific bands
    >>> original_bands = list(image.names.keys())
    >>> image_selected = image.select_bands(['NIR', 'Red', 'Green'])
    >>> print(f"Original bands: {original_bands}, New bands: {list(image_selected.names.keys())}")
    >>>
    >>> # Keep bands and renumber them sequentially
    >>> image.select_bands([4, 3, 2], reformat_names=True, inplace=True)
    >>> print(f"Band names after reordering: {list(image.names.keys())}")
    >>>
    >>> # Select a single band
    >>> nir = image.select_bands('NIR', dest_name='nir_only.tif')

    Notes
    -----
    - This method permanently removes non-selected bands from the image.
    - Use get_bands() instead if you want to preserve the original image.
    - If band names contain duplicates, they will be automatically reformatted.
    - The band order in the result matches the order in the 'bands' parameter.
2) Function select_bands
image_bands = image.select_bands(["8",10],reformat_names=False)
print("Before selection")
image.info()
print("After selection")
image_bands.info()
Before selection
- Size of the image:
   - Rows (height): 1000
   - Cols (width): 1000
   - Bands: 12
- Spatial resolution: 10.0  meters / degree (depending on projection system)
- Central point latitude - longitude coordinates: (7.04099599, 38.39058840)
- Driver: GTiff
- Data type: int16
- Projection system: EPSG:32637
- Nodata: -32768.0

- Given names for spectral bands:
   {'1': 1, '2': 2, '3': 3, '4': 4, '5': 5, '6': 6, '7': 7, '8': 8, '9': 9, '10': 10, '11': 11, '12': 12}


After selection
- Size of the image:
   - Rows (height): 1000
   - Cols (width): 1000
   - Bands: 2
- Spatial resolution: 10.0  meters / degree (depending on projection system)
- Central point latitude - longitude coordinates: (7.04099599, 38.39058840)
- Driver: GTiff
- Data type: int16
- Projection system: EPSG:32637
- Nodata: -32768.0

- Given names for spectral bands:
   {'8': 1, '10': 2}
As can be seen, the names of bands is {‘8’: 1, ‘10’: 2}
If now we extract two times a similar band, (ex [8,10,8]), names will be automatically reformatted
image_bands = image.select_bands(["8",10,8],reformat_names=False)
print("Before selection")
image.info()
print("After selection")
image_bands.info()
Before selection
- Size of the image:
   - Rows (height): 1000
   - Cols (width): 1000
   - Bands: 12
- Spatial resolution: 10.0  meters / degree (depending on projection system)
- Central point latitude - longitude coordinates: (7.04099599, 38.39058840)
- Driver: GTiff
- Data type: int16
- Projection system: EPSG:32637
- Nodata: -32768.0

- Given names for spectral bands:
   {'1': 1, '2': 2, '3': 3, '4': 4, '5': 5, '6': 6, '7': 7, '8': 8, '9': 9, '10': 10, '11': 11, '12': 12}


After selection
- Size of the image:
   - Rows (height): 1000
   - Cols (width): 1000
   - Bands: 3
- Spatial resolution: 10.0  meters / degree (depending on projection system)
- Central point latitude - longitude coordinates: (7.04099599, 38.39058840)
- Driver: GTiff
- Data type: int16
- Projection system: EPSG:32637
- Nodata: -32768.0

- Given names for spectral bands:
   {'1': 1, '2': 2, '3': 3}
2) Function select_bands with inplace=True
names = {"NIR":8,"G":3,"CO" : 1,"SWIR2":11,"B": 2,"R":4,"RE1":5,"RE2":6,"RE3":7,"WA":9,"SWIR1":10,"SWIR3":12}
image_names=rastereasy.Geoimage(name_im,names=names,history=True)
print("Reading with names\n")
print("Before selection")
image_names.info()
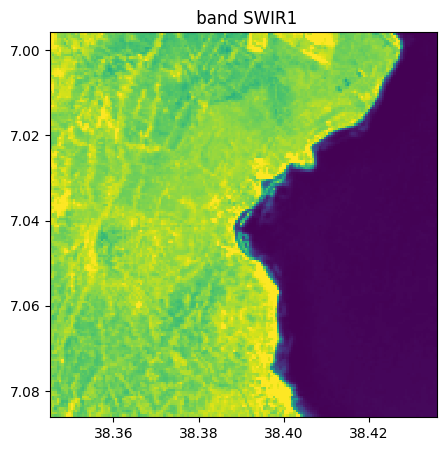
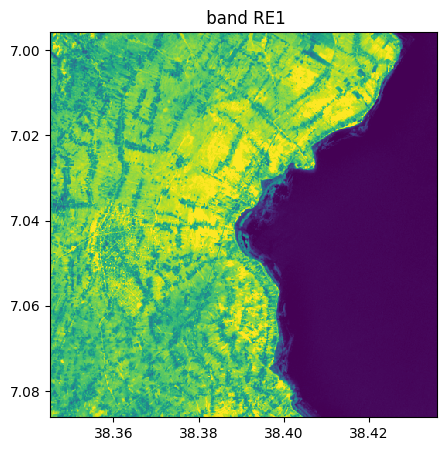
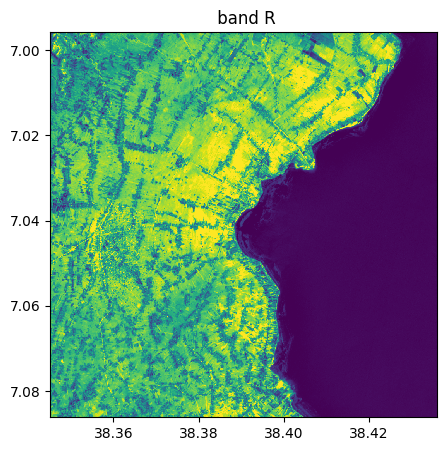
image_names.select_bands(["SWIR1","NIR","RE1"],reformat_names=False, inplace=True)
print("After selection")
image_names.info()
image_names.visu()
Reading with names

Before selection
- Size of the image:
   - Rows (height): 1000
   - Cols (width): 1000
   - Bands: 12
- Spatial resolution: 10.0  meters / degree (depending on projection system)
- Central point latitude - longitude coordinates: (7.04099599, 38.39058840)
- Driver: GTiff
- Data type: int16
- Projection system: EPSG:32637
- Nodata: -32768.0

- Given names for spectral bands:
   {'CO': 1, 'B': 2, 'G': 3, 'R': 4, 'RE1': 5, 'RE2': 6, 'RE3': 7, 'NIR': 8, 'WA': 9, 'SWIR1': 10, 'SWIR2': 11, 'SWIR3': 12}

--- History of modifications---
[2025-06-04 15:28:54] - Read image ./data/demo/sentinel.tif


After selection
- Size of the image:
   - Rows (height): 1000
   - Cols (width): 1000
   - Bands: 3
- Spatial resolution: 10.0  meters / degree (depending on projection system)
- Central point latitude - longitude coordinates: (7.04099599, 38.39058840)
- Driver: GTiff
- Data type: int16
- Projection system: EPSG:32637
- Nodata: -32768.0

- Given names for spectral bands:
   {'SWIR1': 1, 'NIR': 2, 'RE1': 3}

--- History of modifications---
[2025-06-04 15:28:54] - Read image ./data/demo/sentinel.tif
[2025-06-04 15:28:54] - Selected 3/12 bands: ['SWIR1', 'NIR', 'RE1']. Band names were preserved with updated indices.
<Figure size 640x480 with 0 Axes>

Extract from image
Entire image in numpy array
im=image.numpy_channel_first()
print(im.shape)
(12, 1000, 1000)
im=image.numpy_channel_last()
print(im.shape)
(1000, 1000, 12)
Some channels in numpy array
a) without names
bands=["1","4","3"]
im=image.numpy_channel_first(bands=bands)
print(im.shape)
bands=[1,4,3,8]
im=image.numpy_channel_last(bands=bands)
print(im.shape)
(3, 1000, 1000)
(1000, 1000, 4)
a) with names
# re-read image_names since it has been modified
names = {"NIR":8,"G":3,"CO" : 1,"SWIR2":11,"B": 2,"R":4,"RE1":5,"RE2":6,"RE3":7,"WA":9,"SWIR1":10,"SWIR3":12}
image_names=rastereasy.Geoimage(name_im,names=names,history=True)


bands=["R","G","B"]
im=image_names.numpy_channel_first(bands=bands)
print(im.shape)
bands=["R","NIR","G","B"]
im=image_names.numpy_channel_last(bands=bands)
print(im.shape)
(3, 1000, 1000)
(1000, 1000, 4)
Entire image in table of size (row*col, bands)
help(image.numpy_table)
Help on method numpy_table in module rastereasy.rastereasy:

numpy_table(bands=None) method of rastereasy.rastereasy.Geoimage instance
    Extract image data as a 2D table of shape (pixels, bands).

    This method reshapes the image into a 2D table where each row represents a pixel
    and each column represents a band. This format is useful for machine learning,
    statistical analysis, or any operation that treats pixels as independent samples.

    Parameters
    ----------
    bands : str, list of str, or None, optional
        The bands to include in the output:
        - If None: Returns all bands
        - If a string: Returns a single specified band
        - If a list: Returns the specified bands in the given order
        Default is None.

    Returns
    -------
    numpy.ndarray
        Image data as a 2D table with shape (rows*cols, bands)

    Examples
    --------
    >>> # Convert the entire image to a table
    >>> table = image.numpy_table()
    >>> print(f"Table shape: {table.shape}")
    >>>
    >>> # Process specific bands as a table
    >>> nir_red = image.numpy_table(bands=["NIR", "R"])
    >>> print(f"Shape: {nir_red.shape}")
    >>> ndvi = (nir_red[:, 0] - nir_red[:, 1]) / (nir_red[:, 0] + nir_red[:, 1])
    >>> print(f"Mean NDVI: {ndvi.mean()}")

    Notes
    -----
    This format is particularly useful for:
    - Machine learning where each pixel is a sample and each band is a feature
    - Clustering algorithms like K-means
    - Statistical analysis across bands
    - Vectorized operations on pixels
table=image.numpy_table()
print(table.shape)
(1000000, 12)
# recovering an image from this table
help(rastereasy.table2image)
Help on function table2image in module rastereasy.rastereasy:

table2image(table, size, channel_first=True)
    Reshape a 2D table back into a 3D image.

    Parameters
    ----------
    table : numpy.ndarray
        Input table with shape (rows*cols, bands) or (rows*cols,).
    size : tuple
        Size of the output image as (rows, cols).
    channel_first : bool, optional
        If True, output will have shape (bands, rows, cols).
        If False, output will have shape (rows, cols, bands).
        Default is True.

    Returns
    -------
    numpy.ndarray
        Reshaped 3D image.

    Examples
    --------
    >>> image = table2image(table, (400, 600), channel_first=True)
# Test with channel first recovery
image_recovered=rastereasy.table2image(table,image.shape)
print(image_recovered.shape)
# Test with channel last recovery
image_recovered=rastereasy.table2image(table,image.shape,channel_first=False)
print(image_recovered.shape)
(12, 1000, 1000)
(1000, 1000, 12)
# We can directly create a geoimage from the table. Dimensions should match
# Example with the 8 first bands
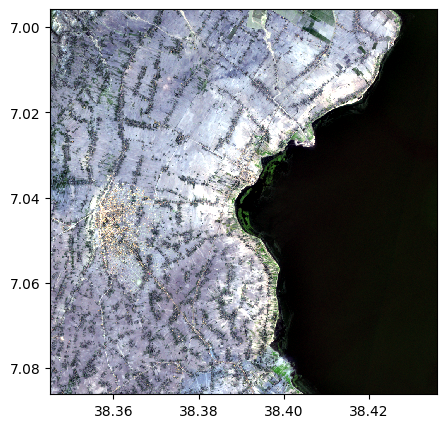
image_recovered=image.image_from_table(table[:,1:4],names={"R":3,"G":2,"B":1},dest_name='./data/results/change_bands/image_from_table1.tif')
image_recovered.info()
image_recovered.visu()
image_recovered.colorcomp()
- Size of the image:
   - Rows (height): 1000
   - Cols (width): 1000
   - Bands: 3
- Spatial resolution: 10.0  meters / degree (depending on projection system)
- Central point latitude - longitude coordinates: (7.04099599, 38.39058840)
- Driver: GTiff
- Data type: int16
- Projection system: EPSG:32637
- Nodata: -32768.0

- Given names for spectral bands:
   {'B': 1, 'G': 2, 'R': 3}
<Figure size 640x480 with 0 Axes>
<Figure size 640x480 with 0 Axes>
help(image.upload_table)
image_recovered.info()
image.info()
image.activate_history()
image.upload_table(table[:,2:5],names={"R":3,"G":2,"B":1},dest_name='./data/results/change_bands/image_from_table2.tif')
image.info()
Help on method upload_table in module rastereasy.rastereasy:

upload_table(table, names=None, dest_name=None) method of rastereasy.rastereasy.Geoimage instance
    Update the image data with a 2D table of shape (pixels, bands).

    This method replaces the current image data with the content of a 2D table where
    each row represents a pixel and each column represents a band. The table is
    reshaped to match the image dimensions.

    Parameters
    ----------
    table : numpy.ndarray
        The 2D table to upload, with shape (rows*cols, bands) or (rows*cols,) for a single band.
    names : dict, optional
        Dictionary mapping band names to band indices. If None, bands will be named
        sequentially ("1", "2", "3", ...).
        Default is None.
    dest_name : str, optional
        Path to save the updated image. If None, the image is not saved.
        Default is None.

    Returns
    -------
    self : Geoimage
        The updated image, allowing method chaining

    Raises
    ------
    ValueError
        If the number of rows in the table doesn't match the dimensions of the original image

    Examples
    --------
    >>> # Update an image with processed data
    >>> table = image.numpy_table()
    >>> table = np.log(table + 1)  # Log transform
    >>> image.upload_table(table)
    >>> image.visu()
    >>>
    >>> # Upload a single-band result and save
    >>> ndvi_table = (nir - red) / (nir + red)  # Assuming nir and red are numpy arrays
    >>> image.upload_table(ndvi_table, names={"NDVI": 1}, dest_name="ndvi.tif")

    Notes
    -----
    Unlike image_from_table() which creates a new image, this method modifies the
    current image in place. The dimensions of the image (rows, cols) are preserved,
    but the number of bands can change if the table has a different number of columns.

- Size of the image:
   - Rows (height): 1000
   - Cols (width): 1000
   - Bands: 3
- Spatial resolution: 10.0  meters / degree (depending on projection system)
- Central point latitude - longitude coordinates: (7.04099599, 38.39058840)
- Driver: GTiff
- Data type: int16
- Projection system: EPSG:32637
- Nodata: -32768.0

- Given names for spectral bands:
   {'B': 1, 'G': 2, 'R': 3}


- Size of the image:
   - Rows (height): 1000
   - Cols (width): 1000
   - Bands: 12
- Spatial resolution: 10.0  meters / degree (depending on projection system)
- Central point latitude - longitude coordinates: (7.04099599, 38.39058840)
- Driver: GTiff
- Data type: int16
- Projection system: EPSG:32637
- Nodata: -32768.0

- Given names for spectral bands:
   {'1': 1, '2': 2, '3': 3, '4': 4, '5': 5, '6': 6, '7': 7, '8': 8, '9': 9, '10': 10, '11': 11, '12': 12}


- Size of the image:
   - Rows (height): 1000
   - Cols (width): 1000
   - Bands: 3
- Spatial resolution: 10.0  meters / degree (depending on projection system)
- Central point latitude - longitude coordinates: (7.04099599, 38.39058840)
- Driver: GTiff
- Data type: int16
- Projection system: EPSG:32637
- Nodata: -32768.0

- Given names for spectral bands:
   {'B': 1, 'G': 2, 'R': 3}

--- History of modifications---
[2025-06-04 15:28:54] - Saved to ./data/results/change_bands/image_from_table2.tif
[2025-06-04 15:28:54] - Uploaded new image from table with 3 bands
	 Image saved to: ./data/results/change_bands/image_from_table2.tif
Some bands in table of size (row*col, bands)
bands=["R","NIR","G"]
table=image_names.numpy_table(bands)
print(table.shape)
(1000000, 3)
# Test with channel first recovery
image_recovered=rastereasy.table2image(table,image_names.shape)
print(image_recovered.shape)
# Test with channel last recovery
image_recovered=rastereasy.table2image(table,image.shape,channel_first=False)
print(image_recovered.shape)
(3, 1000, 1000)
(1000, 1000, 3)